0001633931--12-312024FYfalsehttp://fasb.org/us-gaap/2024#PropertyPlantAndEquipmentAndFinanceLeaseRightOfUseAssetAfterAccumulatedDepreciationAndAmortization00http://fasb.org/us-gaap/2024#PropertyPlantAndEquipmentAndFinanceLeaseRightOfUseAssetAfterAccumulatedDepreciationAndAmortization2026-10-07P0Y0001633931bld:ShareRepurchaseProgram2022Member2022-07-252024-12-310001633931bld:ShareRepurchaseProgram2024Member2024-12-310001633931us-gaap:CommonStockMember2023-01-012023-12-310001633931us-gaap:CommonStockMember2024-01-012024-12-310001633931us-gaap:CommonStockMember2022-01-012022-12-310001633931us-gaap:TreasuryStockCommonMember2024-12-310001633931us-gaap:RetainedEarningsMember2024-12-310001633931us-gaap:CommonStockMember2024-12-310001633931us-gaap:AdditionalPaidInCapitalMember2024-12-310001633931us-gaap:AccumulatedOtherComprehensiveIncomeMember2024-12-310001633931us-gaap:TreasuryStockCommonMember2023-12-310001633931us-gaap:RetainedEarningsMember2023-12-310001633931us-gaap:CommonStockMember2023-12-310001633931us-gaap:AdditionalPaidInCapitalMember2023-12-310001633931us-gaap:AccumulatedOtherComprehensiveIncomeMember2023-12-310001633931us-gaap:TreasuryStockCommonMember2022-12-310001633931us-gaap:RetainedEarningsMember2022-12-310001633931us-gaap:CommonStockMember2022-12-310001633931us-gaap:AdditionalPaidInCapitalMember2022-12-310001633931us-gaap:AccumulatedOtherComprehensiveIncomeMember2022-12-310001633931us-gaap:TreasuryStockCommonMember2021-12-310001633931us-gaap:RetainedEarningsMember2021-12-310001633931us-gaap:CommonStockMember2021-12-310001633931us-gaap:AdditionalPaidInCapitalMember2021-12-310001633931us-gaap:AccumulatedOtherComprehensiveIncomeMember2021-12-310001633931us-gaap:EmployeeStockOptionMember2023-12-310001633931us-gaap:EmployeeStockOptionMember2024-12-310001633931bld:LongTermIncentivePlanMember2024-12-310001633931srt:MaximumMemberbld:LongTermIncentivePlanMember2024-12-310001633931us-gaap:RestrictedStockMember2023-12-310001633931bld:VestingBasedOnServiceMembersrt:MinimumMemberus-gaap:RestrictedStockMember2024-01-012024-12-310001633931bld:VestingBasedOnServiceMembersrt:MaximumMemberus-gaap:RestrictedStockMember2024-01-012024-12-310001633931srt:MinimumMemberus-gaap:EmployeeStockOptionMember2024-01-012024-12-310001633931srt:MaximumMemberus-gaap:EmployeeStockOptionMember2024-01-012024-12-310001633931bld:Acquisitions2023Member2024-01-012024-12-310001633931us-gaap:OperatingSegmentsMemberbld:ResidentialMemberbld:InstallationSegmentMember2024-01-012024-12-310001633931us-gaap:OperatingSegmentsMemberbld:ResidentialMemberbld:DistributionSegmentMember2024-01-012024-12-310001633931us-gaap:OperatingSegmentsMemberbld:RainGuttersMemberbld:InstallationSegmentMember2024-01-012024-12-310001633931us-gaap:OperatingSegmentsMemberbld:RainGuttersMemberbld:DistributionSegmentMember2024-01-012024-12-310001633931us-gaap:OperatingSegmentsMemberbld:InsulationAndAccessoriesMemberbld:InstallationSegmentMember2024-01-012024-12-310001633931us-gaap:OperatingSegmentsMemberbld:InsulationAndAccessoriesMemberbld:DistributionSegmentMember2024-01-012024-12-310001633931us-gaap:OperatingSegmentsMemberbld:GlassAndWindowsMemberbld:InstallationSegmentMember2024-01-012024-12-310001633931us-gaap:OperatingSegmentsMemberbld:CommercialAndIndustrialMemberbld:InstallationSegmentMember2024-01-012024-12-310001633931us-gaap:OperatingSegmentsMemberbld:CommercialAndIndustrialMemberbld:DistributionSegmentMember2024-01-012024-12-310001633931us-gaap:OperatingSegmentsMemberbld:AllOtherProductsMemberbld:InstallationSegmentMember2024-01-012024-12-310001633931us-gaap:OperatingSegmentsMemberbld:AllOtherProductsMemberbld:DistributionSegmentMember2024-01-012024-12-310001633931us-gaap:IntersegmentEliminationMemberbld:ResidentialMember2024-01-012024-12-310001633931us-gaap:IntersegmentEliminationMemberbld:RainGuttersMember2024-01-012024-12-310001633931us-gaap:IntersegmentEliminationMemberbld:InsulationAndAccessoriesMember2024-01-012024-12-310001633931us-gaap:IntersegmentEliminationMemberbld:DistributionSegmentMember2024-01-012024-12-310001633931us-gaap:IntersegmentEliminationMemberbld:CommercialAndIndustrialMember2024-01-012024-12-310001633931us-gaap:IntersegmentEliminationMemberbld:AllOtherProductsMember2024-01-012024-12-310001633931bld:ResidentialMember2024-01-012024-12-310001633931bld:RainGuttersMember2024-01-012024-12-310001633931bld:InsulationAndAccessoriesMember2024-01-012024-12-310001633931bld:GlassAndWindowsMember2024-01-012024-12-310001633931bld:CommercialAndIndustrialMember2024-01-012024-12-310001633931bld:AllOtherProductsMember2024-01-012024-12-310001633931us-gaap:OperatingSegmentsMemberbld:ResidentialMemberbld:InstallationSegmentMember2023-01-012023-12-310001633931us-gaap:OperatingSegmentsMemberbld:ResidentialMemberbld:DistributionSegmentMember2023-01-012023-12-310001633931us-gaap:OperatingSegmentsMemberbld:RainGuttersMemberbld:InstallationSegmentMember2023-01-012023-12-310001633931us-gaap:OperatingSegmentsMemberbld:RainGuttersMemberbld:DistributionSegmentMember2023-01-012023-12-310001633931us-gaap:OperatingSegmentsMemberbld:InsulationAndAccessoriesMemberbld:InstallationSegmentMember2023-01-012023-12-310001633931us-gaap:OperatingSegmentsMemberbld:InsulationAndAccessoriesMemberbld:DistributionSegmentMember2023-01-012023-12-310001633931us-gaap:OperatingSegmentsMemberbld:GlassAndWindowsMemberbld:InstallationSegmentMember2023-01-012023-12-310001633931us-gaap:OperatingSegmentsMemberbld:CommercialAndIndustrialMemberbld:InstallationSegmentMember2023-01-012023-12-310001633931us-gaap:OperatingSegmentsMemberbld:CommercialAndIndustrialMemberbld:DistributionSegmentMember2023-01-012023-12-310001633931us-gaap:OperatingSegmentsMemberbld:AllOtherProductsMemberbld:InstallationSegmentMember2023-01-012023-12-310001633931us-gaap:OperatingSegmentsMemberbld:AllOtherProductsMemberbld:DistributionSegmentMember2023-01-012023-12-310001633931us-gaap:IntersegmentEliminationMemberbld:ResidentialMember2023-01-012023-12-310001633931us-gaap:IntersegmentEliminationMemberbld:RainGuttersMember2023-01-012023-12-310001633931us-gaap:IntersegmentEliminationMemberbld:InsulationAndAccessoriesMember2023-01-012023-12-310001633931us-gaap:IntersegmentEliminationMemberbld:DistributionSegmentMember2023-01-012023-12-310001633931us-gaap:IntersegmentEliminationMemberbld:CommercialAndIndustrialMember2023-01-012023-12-310001633931us-gaap:IntersegmentEliminationMemberbld:AllOtherProductsMember2023-01-012023-12-310001633931bld:ResidentialMember2023-01-012023-12-310001633931bld:RainGuttersMember2023-01-012023-12-310001633931bld:InsulationAndAccessoriesMember2023-01-012023-12-310001633931bld:GlassAndWindowsMember2023-01-012023-12-310001633931bld:CommercialAndIndustrialMember2023-01-012023-12-310001633931bld:AllOtherProductsMember2023-01-012023-12-310001633931us-gaap:OperatingSegmentsMemberbld:ResidentialMemberbld:InstallationSegmentMember2022-01-012022-12-310001633931us-gaap:OperatingSegmentsMemberbld:ResidentialMemberbld:DistributionSegmentMember2022-01-012022-12-310001633931us-gaap:OperatingSegmentsMemberbld:RainGuttersMemberbld:InstallationSegmentMember2022-01-012022-12-310001633931us-gaap:OperatingSegmentsMemberbld:RainGuttersMemberbld:DistributionSegmentMember2022-01-012022-12-310001633931us-gaap:OperatingSegmentsMemberbld:InsulationAndAccessoriesMemberbld:InstallationSegmentMember2022-01-012022-12-310001633931us-gaap:OperatingSegmentsMemberbld:InsulationAndAccessoriesMemberbld:DistributionSegmentMember2022-01-012022-12-310001633931us-gaap:OperatingSegmentsMemberbld:GlassAndWindowsMemberbld:InstallationSegmentMember2022-01-012022-12-310001633931us-gaap:OperatingSegmentsMemberbld:CommercialAndIndustrialMemberbld:InstallationSegmentMember2022-01-012022-12-310001633931us-gaap:OperatingSegmentsMemberbld:CommercialAndIndustrialMemberbld:DistributionSegmentMember2022-01-012022-12-310001633931us-gaap:OperatingSegmentsMemberbld:AllOtherProductsMemberbld:InstallationSegmentMember2022-01-012022-12-310001633931us-gaap:OperatingSegmentsMemberbld:AllOtherProductsMemberbld:DistributionSegmentMember2022-01-012022-12-310001633931us-gaap:IntersegmentEliminationMemberbld:ResidentialMember2022-01-012022-12-310001633931us-gaap:IntersegmentEliminationMemberbld:RainGuttersMember2022-01-012022-12-310001633931us-gaap:IntersegmentEliminationMemberbld:InsulationAndAccessoriesMember2022-01-012022-12-310001633931us-gaap:IntersegmentEliminationMemberbld:DistributionSegmentMember2022-01-012022-12-310001633931us-gaap:IntersegmentEliminationMemberbld:CommercialAndIndustrialMember2022-01-012022-12-310001633931us-gaap:IntersegmentEliminationMemberbld:AllOtherProductsMember2022-01-012022-12-310001633931bld:ResidentialMember2022-01-012022-12-310001633931bld:RainGuttersMember2022-01-012022-12-310001633931bld:InsulationAndAccessoriesMember2022-01-012022-12-310001633931bld:InstallationSegmentMember2022-01-012022-12-310001633931bld:GlassAndWindowsMember2022-01-012022-12-310001633931bld:DistributionSegmentMember2022-01-012022-12-310001633931bld:CommercialAndIndustrialMember2022-01-012022-12-310001633931bld:AllOtherProductsMember2022-01-012022-12-310001633931srt:MinimumMemberus-gaap:VehiclesMember2024-12-310001633931srt:MinimumMemberus-gaap:SoftwareDevelopmentMember2024-12-310001633931srt:MinimumMemberus-gaap:LandBuildingsAndImprovementsMember2024-12-310001633931srt:MinimumMemberus-gaap:EquipmentMember2024-12-310001633931srt:MaximumMemberus-gaap:VehiclesMember2024-12-310001633931srt:MaximumMemberus-gaap:SoftwareDevelopmentMember2024-12-310001633931srt:MaximumMemberus-gaap:LandBuildingsAndImprovementsMember2024-12-310001633931srt:MaximumMemberus-gaap:EquipmentMember2024-12-310001633931us-gaap:VehiclesMember2024-12-310001633931us-gaap:LandAndLandImprovementsMember2024-12-310001633931us-gaap:EquipmentMember2024-12-310001633931us-gaap:BuildingMember2024-12-310001633931bld:ComputerHardwareAndSoftwareMember2024-12-310001633931us-gaap:VehiclesMember2023-12-310001633931us-gaap:LandAndLandImprovementsMember2023-12-310001633931us-gaap:EquipmentMember2023-12-310001633931us-gaap:BuildingMember2023-12-310001633931bld:ComputerHardwareAndSoftwareMember2023-12-310001633931us-gaap:AccumulatedOtherComprehensiveIncomeMember2024-01-012024-12-310001633931us-gaap:AccumulatedOtherComprehensiveIncomeMember2023-01-012023-12-310001633931us-gaap:AccumulatedOtherComprehensiveIncomeMember2022-01-012022-12-310001633931us-gaap:IntersegmentEliminationMember2024-01-012024-12-310001633931us-gaap:IntersegmentEliminationMember2023-01-012023-12-310001633931us-gaap:IntersegmentEliminationMember2022-01-012022-12-310001633931us-gaap:RetainedEarningsMember2024-01-012024-12-310001633931us-gaap:RetainedEarningsMember2023-01-012023-12-310001633931us-gaap:RetainedEarningsMember2022-01-012022-12-310001633931bld:CarpentersPensionTrustFundForNorthernCaliforniaEmployeesPensionFundMember2023-01-012023-12-310001633931bld:CarpentersPensionTrustFundForNorthernCaliforniaEmployeesPensionFundMember2022-01-012022-12-310001633931srt:MinimumMemberus-gaap:RevolvingCreditFacilityMember2024-01-012024-12-310001633931srt:MaximumMemberus-gaap:RevolvingCreditFacilityMember2024-01-012024-12-310001633931bld:AmendmentNo.4ToCreditAgreementMemberus-gaap:SecuredDebtMember2024-12-310001633931bld:AmendmentNo.4ToCreditAgreementMemberbld:DelayedDrawTermLoanFacilityTwoMember2023-07-260001633931us-gaap:RevolvingCreditFacilityMember2024-12-310001633931us-gaap:RevolvingCreditFacilityMember2023-12-310001633931bld:InstallationSegmentMember2024-01-012024-12-310001633931bld:InstallationSegmentMember2023-01-012023-12-3100016339312023-10-012023-12-3100016339312022-10-012022-12-310001633931bld:InstallationSegmentMember2022-12-310001633931bld:DistributionSegmentMember2022-12-310001633931bld:DistributionSegmentMember2024-01-012024-12-310001633931bld:DistributionSegmentMember2023-01-012023-12-310001633931bld:InstallationSegmentMember2024-12-310001633931bld:DistributionSegmentMember2024-12-310001633931bld:InstallationSegmentMember2023-12-310001633931bld:DistributionSegmentMember2023-12-310001633931us-gaap:TrademarksMember2024-12-310001633931us-gaap:NoncompeteAgreementsMember2024-12-310001633931us-gaap:CustomerRelationshipsMember2024-12-310001633931us-gaap:TrademarksMember2023-12-310001633931us-gaap:NoncompeteAgreementsMember2023-12-310001633931us-gaap:CustomerRelationshipsMember2023-12-310001633931us-gaap:RestrictedStockMember2024-12-310001633931us-gaap:CorporateNonSegmentMember2024-01-012024-12-310001633931us-gaap:CorporateNonSegmentMember2023-01-012023-12-310001633931us-gaap:CorporateNonSegmentMember2022-01-012022-12-310001633931bld:SeniorNotesDue2032Memberus-gaap:DebtInstrumentRedemptionPeriodFourMember2024-01-012024-12-310001633931bld:SeniorNotesDue2032Memberus-gaap:DebtInstrumentRedemptionPeriodFiveMember2024-01-012024-12-310001633931bld:SeniorNotesDue2032Memberbld:DebtInstrumentRedemptionPeriodSevenMember2024-01-012024-12-310001633931bld:SeniorNotesDue2029Memberus-gaap:DebtInstrumentRedemptionPeriodTwoMember2024-01-012024-12-310001633931bld:SeniorNotesDue2029Memberus-gaap:DebtInstrumentRedemptionPeriodThreeMember2024-01-012024-12-310001633931bld:ChangeInControlScenarioMemberbld:SeniorNotesDue2032Member2024-01-012024-12-310001633931bld:ChangeInControlScenarioMemberbld:SeniorNotesDue2029Member2024-01-012024-12-310001633931bld:AmendmentNo.4ToCreditAgreementMember2024-01-012024-12-310001633931bld:AmendmentNo.4ToCreditAgreementMember2024-12-310001633931bld:SeniorNotesDue2032Memberus-gaap:FairValueInputsLevel1Memberus-gaap:FairValueMeasurementsNonrecurringMember2024-12-310001633931bld:SeniorNotesDue2029Memberus-gaap:FairValueInputsLevel1Memberus-gaap:FairValueMeasurementsNonrecurringMember2024-12-310001633931us-gaap:SecuredDebtMember2024-12-310001633931bld:SeniorNotesDue2032Member2024-12-310001633931bld:SeniorNotesDue2032Member2024-12-310001633931bld:SeniorNotesDue2029Member2024-12-310001633931bld:SeniorNotesDue2029Member2024-12-310001633931us-gaap:SecuredDebtMember2023-12-310001633931bld:SeniorNotesDue2032Member2023-12-310001633931bld:SeniorNotesDue2029Member2023-12-310001633931bld:EquipmentNotesMember2023-12-310001633931bld:BaseRateBorrowingsMemberbld:AmendmentNo.4ToCreditAgreementMemberbld:DelayedDrawTermLoanFacilityOneMemberus-gaap:SecuredOvernightFinancingRateSofrMember2024-01-012024-12-310001633931bld:BaseRateBorrowingsMemberbld:AmendmentNo.4ToCreditAgreementMemberbld:FederalFundsRateMember2024-01-012024-12-310001633931us-gaap:OperatingSegmentsMemberbld:InstallationSegmentMember2024-01-012024-12-310001633931us-gaap:OperatingSegmentsMemberbld:DistributionSegmentMember2024-01-012024-12-310001633931us-gaap:OperatingSegmentsMember2024-01-012024-12-310001633931us-gaap:OperatingSegmentsMemberbld:InstallationSegmentMember2023-01-012023-12-310001633931us-gaap:OperatingSegmentsMemberbld:DistributionSegmentMember2023-01-012023-12-310001633931us-gaap:OperatingSegmentsMember2023-01-012023-12-310001633931us-gaap:OperatingSegmentsMemberbld:InstallationSegmentMember2022-01-012022-12-310001633931us-gaap:OperatingSegmentsMemberbld:DistributionSegmentMember2022-01-012022-12-310001633931us-gaap:OperatingSegmentsMember2022-01-012022-12-310001633931us-gaap:AccruedLiabilitiesMember2024-12-310001633931us-gaap:AccruedLiabilitiesMember2023-12-310001633931bld:ReceivablesNetMember2024-12-310001633931bld:ReceivablesNetMember2023-12-310001633931bld:AccountsReceivableNetCurrentMember2024-12-310001633931bld:AccountsReceivableNetCurrentMember2023-12-3100016339312022-12-3100016339312021-12-310001633931bld:Acquisitions2024Memberus-gaap:CustomerRelationshipsMember2024-12-310001633931us-gaap:SeriesOfIndividuallyImmaterialBusinessAcquisitionsMember2024-01-012024-12-310001633931bld:Acquisitions2024Member2024-01-012024-12-310001633931bld:SriHoldingsMember2023-01-232023-01-230001633931us-gaap:SeriesOfIndividuallyImmaterialBusinessAcquisitionsMember2023-01-012023-12-310001633931bld:Acquisitions2023Member2023-01-012023-12-310001633931bld:ShannonMember2024-12-022024-12-020001633931bld:MetroMember2024-12-022024-12-020001633931bld:TexasInsulationMember2024-05-312024-05-310001633931bld:InsulationWorksIncMember2024-05-162024-05-160001633931bld:GreenSpaceMember2024-04-182024-04-180001633931bld:MorrisBlackMember2024-03-012024-03-010001633931bld:CommercialInsulationBusinessPciMember2024-03-012024-03-010001633931bld:BrabbleMember2024-02-152024-02-150001633931bld:BestInsulationMember2023-07-172023-07-170001633931bld:SriHoldingsMember2023-01-262023-01-260001633931bld:SpiMember2024-01-012024-12-310001633931us-gaap:OperatingSegmentsMemberbld:InstallationSegmentMember2024-12-310001633931us-gaap:OperatingSegmentsMemberbld:DistributionSegmentMember2024-12-310001633931us-gaap:OperatingSegmentsMember2024-12-310001633931us-gaap:CorporateNonSegmentMember2024-12-310001633931us-gaap:OperatingSegmentsMemberbld:InstallationSegmentMember2023-12-310001633931us-gaap:OperatingSegmentsMemberbld:DistributionSegmentMember2023-12-310001633931us-gaap:OperatingSegmentsMember2023-12-310001633931us-gaap:CorporateNonSegmentMember2023-12-310001633931bld:VestingBasedOnMarketConditionsMemberus-gaap:RestrictedStockMember2024-01-012024-12-310001633931bld:VestingBasedOnMarketConditionsMemberus-gaap:RestrictedStockMember2023-01-012023-12-310001633931us-gaap:EmployeeStockOptionMember2023-01-012023-12-310001633931bld:VestingBasedOnServiceMemberus-gaap:RestrictedStockMember2022-01-012022-12-310001633931bld:VestingBasedOnPerformanceMemberus-gaap:RestrictedStockMember2022-01-012022-12-310001633931bld:VestingBasedOnMarketConditionsMemberus-gaap:RestrictedStockMember2022-01-012022-12-310001633931us-gaap:EmployeeStockOptionMember2022-01-012022-12-310001633931us-gaap:AdditionalPaidInCapitalMember2024-01-012024-12-310001633931us-gaap:AdditionalPaidInCapitalMember2023-01-012023-12-310001633931us-gaap:AdditionalPaidInCapitalMember2022-01-012022-12-310001633931us-gaap:TreasuryStockCommonMember2023-01-012023-12-310001633931bld:Acquisitions2024Memberus-gaap:CustomerRelationshipsMember2024-01-012024-12-310001633931bld:ShareRepurchaseProgram2025Memberus-gaap:SubsequentEventMember2025-02-170001633931bld:ShareRepurchaseProgram2024Member2024-05-040001633931bld:ShareRepurchaseProgram2022Member2022-07-2500016339312024-10-012024-12-3100016339312024-06-3000016339312025-02-180001633931us-gaap:TreasuryStockCommonMember2024-01-012024-12-310001633931us-gaap:TreasuryStockCommonMember2022-01-012022-12-310001633931bld:ShareBasedCompensationArrangementByShareBasedPaymentAwardPayoutRangeTwoMemberbld:VestingBasedOnPerformanceMemberus-gaap:RestrictedStockMember2024-02-210001633931bld:ShareBasedCompensationArrangementByShareBasedPaymentAwardPayoutRangeThreeMemberbld:VestingBasedOnPerformanceMemberus-gaap:RestrictedStockMember2024-02-210001633931bld:ShareBasedCompensationArrangementByShareBasedPaymentAwardPayoutRangeFourMemberbld:VestingBasedOnPerformanceMemberus-gaap:RestrictedStockMember2024-02-210001633931bld:VestingBasedOnPerformanceMembersrt:MinimumMemberus-gaap:RestrictedStockMember2024-12-310001633931bld:VestingBasedOnPerformanceMembersrt:MaximumMemberus-gaap:RestrictedStockMember2024-12-310001633931bld:ShareBasedCompensationArrangementByShareBasedPaymentAwardPayoutRangeTwoMemberbld:VestingBasedOnPerformanceMemberus-gaap:RestrictedStockMember2023-02-210001633931bld:ShareBasedCompensationArrangementByShareBasedPaymentAwardPayoutRangeThreeMemberbld:VestingBasedOnPerformanceMemberus-gaap:RestrictedStockMember2023-02-210001633931bld:ShareBasedCompensationArrangementByShareBasedPaymentAwardPayoutRangeOneMemberbld:VestingBasedOnPerformanceMemberus-gaap:RestrictedStockMember2023-02-210001633931bld:ShareBasedCompensationArrangementByShareBasedPaymentAwardPayoutRangeFourMemberbld:VestingBasedOnPerformanceMemberus-gaap:RestrictedStockMember2023-02-210001633931bld:ShareBasedCompensationArrangementByShareBasedPaymentAwardPayoutRangeTwoMemberbld:VestingBasedOnPerformanceMemberus-gaap:RestrictedStockMember2022-02-150001633931bld:ShareBasedCompensationArrangementByShareBasedPaymentAwardPayoutRangeThreeMemberbld:VestingBasedOnPerformanceMemberus-gaap:RestrictedStockMember2022-02-150001633931bld:ShareBasedCompensationArrangementByShareBasedPaymentAwardPayoutRangeOneMemberbld:VestingBasedOnPerformanceMemberus-gaap:RestrictedStockMember2022-02-150001633931bld:ShareBasedCompensationArrangementByShareBasedPaymentAwardPayoutRangeFourMemberbld:VestingBasedOnPerformanceMemberus-gaap:RestrictedStockMember2022-02-150001633931bld:ShareBasedCompensationArrangementByShareBasedPaymentAwardPayoutRangeTwoMemberbld:VestingBasedOnPerformanceMemberus-gaap:RestrictedStockMember2021-02-160001633931bld:ShareBasedCompensationArrangementByShareBasedPaymentAwardPayoutRangeThreeMemberbld:VestingBasedOnPerformanceMemberus-gaap:RestrictedStockMember2021-02-160001633931bld:ShareBasedCompensationArrangementByShareBasedPaymentAwardPayoutRangeOneMemberbld:VestingBasedOnPerformanceMemberus-gaap:RestrictedStockMember2021-02-160001633931bld:ShareBasedCompensationArrangementByShareBasedPaymentAwardPayoutRangeFourMemberbld:VestingBasedOnPerformanceMemberus-gaap:RestrictedStockMember2021-02-160001633931bld:VestingBasedOnPerformanceMemberus-gaap:RestrictedStockMember2024-02-212024-02-210001633931bld:VestingBasedOnPerformanceMemberus-gaap:RestrictedStockMember2023-02-212023-02-210001633931bld:VestingBasedOnPerformanceMemberus-gaap:RestrictedStockMember2022-02-152022-02-150001633931bld:VestingBasedOnPerformanceMemberbld:RestrictedStockAwardsGrantedFebruary2021Member2024-01-012024-03-310001633931us-gaap:EmployeeStockOptionMember2024-01-012024-12-310001633931bld:VestingBasedOnMarketConditionsMemberus-gaap:RestrictedStockMember2024-01-012024-12-310001633931bld:VestingBasedOnMarketConditionsMemberus-gaap:RestrictedStockMember2023-01-012023-12-310001633931bld:VestingBasedOnMarketConditionsMemberus-gaap:RestrictedStockMember2022-01-012022-12-310001633931us-gaap:RestrictedStockMember2024-01-012024-12-310001633931bld:VestingBasedOnPerformanceMemberus-gaap:RestrictedStockMember2024-01-012024-12-310001633931bld:CarpentersPensionTrustFundForNorthernCaliforniaEmployeesPensionFundMember2024-01-012024-12-310001633931bld:EventOfDefaultScenarioMemberus-gaap:SeniorNotesMember2024-01-012024-12-310001633931bld:AmendmentNo.4ToCreditAgreementMemberus-gaap:RevolvingCreditFacilityMember2024-12-310001633931bld:VestingBasedOnServiceMember2024-01-012024-12-310001633931bld:VestingBasedOnPerformanceMember2024-01-012024-12-310001633931bld:VestingBasedOnMarketConditionsMember2024-01-012024-12-310001633931bld:VestingBasedOnServiceMember2023-01-012023-12-310001633931bld:VestingBasedOnPerformanceMember2023-01-012023-12-310001633931bld:VestingBasedOnMarketConditionsMember2023-01-012023-12-310001633931bld:VestingBasedOnServiceMember2022-01-012022-12-310001633931bld:VestingBasedOnPerformanceMember2022-01-012022-12-310001633931bld:VestingBasedOnMarketConditionsMember2022-01-012022-12-3100016339312023-01-012023-12-3100016339312022-01-012022-12-310001633931bld:BaseRateBorrowingsMemberbld:AmendmentNo.4ToCreditAgreementMemberus-gaap:SecuredOvernightFinancingRateSofrMember2024-01-012024-12-310001633931bld:SeniorNotesDue2032Memberbld:DebtInstrumentRedemptionPeriodSixMember2024-01-012024-12-310001633931bld:SofrRateBorrowingsMemberbld:AmendmentNo.4ToCreditAgreementMember2024-01-012024-12-310001633931srt:MinimumMemberbld:SofrRateBorrowingsMemberbld:AmendmentNo.4ToCreditAgreementMemberbld:DelayedDrawTermLoanFacilityOneMember2024-01-012024-12-310001633931srt:MinimumMemberbld:BaseRateBorrowingsMemberbld:AmendmentNo.4ToCreditAgreementMemberbld:DelayedDrawTermLoanFacilityOneMember2024-01-012024-12-310001633931srt:MaximumMemberbld:SofrRateBorrowingsMemberbld:AmendmentNo.4ToCreditAgreementMemberbld:DelayedDrawTermLoanFacilityOneMember2024-01-012024-12-310001633931srt:MaximumMemberbld:BaseRateBorrowingsMemberbld:AmendmentNo.4ToCreditAgreementMemberbld:DelayedDrawTermLoanFacilityOneMember2024-01-012024-12-3100016339312024-04-012024-06-300001633931us-gaap:SeriesOfIndividuallyImmaterialBusinessAcquisitionsMember2024-12-310001633931bld:TexasInsulationMember2024-12-310001633931bld:MetroMember2024-12-310001633931bld:InsulationWorksIncMember2024-12-310001633931bld:Acquisitions2024Member2024-12-310001633931us-gaap:SeriesOfIndividuallyImmaterialBusinessAcquisitionsMember2023-12-310001633931bld:SriHoldingsMember2023-12-310001633931bld:BestInsulationMember2023-12-310001633931bld:Acquisitions2023Member2023-12-3100016339312024-01-012024-12-3100016339312024-12-3100016339312023-12-31iso4217:USDxbrli:purexbrli:sharesbld:itemiso4217:USDxbrli:sharesbld:segment

Table of Contents

UNITED STATES SECURITIES AND EXCHANGE COMMISSION

WASHINGTON, D.C. 20549

FORM 10-K

(Mark One)

ANNUAL REPORT PURSUANT TO SECTION 13 OR 15(d) OF THE SECURITIES EXCHANGE ACT OF 1934

For the fiscal year ended December 31, 2024


TRANSITION REPORT PURSUANT TO SECTION 13 OR 15(d) OF THE SECURITIES EXCHANGE ACT OF 1934

For the transition period from                to               

Commission file number: 001-36870

TopBuild Corp.

(Exact Name of Registrant as Specified in its Charter)

Delaware

(State or Other Jurisdiction of Incorporation or
Organization)

47-3096382

(I.R.S. Employer
Identification No.)

475 North Williamson Boulevard

Daytona Beach, Florida

(Address of Principal Executive Offices)

32114

(Zip Code)

(386) 304-2200

(Registrant’s telephone number, including area code)

Securities registered pursuant to Section 12(b) of the Act:

Title of each class

Trading Symbol(s)

Name of each exchange on which registered

Common stock, par value $0.01 per share

BLD

New York Stock Exchange

Securities registered pursuant to section 12(g) of the Act:

None

Indicate by check mark if the registrant is a well-known seasoned issuer, as defined in Rule 405 of the Securities Act.

Yes             No

Indicate by check mark if the registrant is not required to file reports pursuant to Section 13 or Section 15(d) of the Act.  

Yes             No

Indicate by check mark whether the registrant (1) has filed all reports required to be filed by Section 13 or 15(d) of the Securities Exchange Act of 1934 during the preceding 12 months (or for such shorter period that the registrant was required to file such reports), and (2) has been subject to such filing requirements for the past 90 days.

Yes           No

Indicate by check mark whether the registrant has submitted electronically every Interactive Data File required to be submitted pursuant to Rule 405 of Regulation S-T (§232.405 of this chapter) during the preceding 12 months (or for such shorter period that the registrant was required to submit such files).

Yes           No

Indicate by check mark whether the registrant is a large accelerated filer, an accelerated filer, a non-accelerated filer, a smaller reporting company, or emerging growth company.  See the definitions of “large accelerated filer,” “accelerated filer,” “smaller reporting company,” and “emerging growth company” in Rule 12b-2 of the Exchange Act.  

Large accelerated filer        Accelerated filer      Non-accelerated filer       Smaller reporting company      Emerging growth company

If an emerging growth company, indicate by check mark if the registrant has elected not to use the extended transition period for complying with any new or revised financial accounting standards provided pursuant to Section 13(a) of the Exchange Act.  

Indicate by check mark whether the registrant has filed a report on and attestation to its management’s assessment of the effectiveness of its internal control over financial reporting under Section 404(b) of the Sarbanes-Oxley Act (15 U.S.C. 7262(b)) by the registered public accounting firm that prepared or issued its audit report.

If securities are registered pursuant to Section 12(b) of the Act, indicate by check mark whether the financial statements of the registrant included in the filing reflect the correction of an error to previously issued financial statements.

Indicate by check mark whether any of those error corrections are restatements that required a recovery analysis of incentive-based compensation received by any of the registrant’s executive officers during the relevant recovery period pursuant to §240.10D-1(b).

Indicate by check mark whether the registrant is a shell company (as defined in Rule 12b-2 of the Exchange Act).

Yes             No

The aggregate market value of the registrant’s common stock held by non-affiliates of the registrant based on the closing price of $385.27 per share as reported on the New York Stock Exchange on June 30, 2024, the last business day of the registrant’s most recently completed second fiscal quarter, was approximately $11.7 billion.

Number of shares of common stock outstanding as of February 18, 2025: 29,227,592

DOCUMENTS INCORPORATED BY REFERENCE

Portions of the Registrant’s Proxy Statement for its 2025 Annual Meeting of Shareholders, to be filed with the Securities and Exchange Commission no later than 120 days after December 31, 2024, are incorporated by reference into Part III of this Form 10-K.

Table of Contents

TOPBUILD CORP.

TABLE OF CONTENTS

Page No.

Part I.

Item 1.

Business

4

Item 1A.

Risk Factors

13

Item 1B.

Unresolved Staff Comments

24

Item 1C.

Cybersecurity Risk Management, Strategy and Governance

24

Item 2.

Properties

26

Item 3.

Legal Proceedings

26

Item 4.

Mine Safety Disclosures

26

Part II.

Item 5.

Market for Registrant’s Common Equity, Related Shareholder Matters, and Issuer Purchases of Equity Securities

27

Item 6.

[Reserved]

28

Item 7.

Management’s Discussion and Analysis of Financial Condition and Results of Operations

29

Item 7A.

Quantitative and Qualitative Disclosures about Market Risk

37

Item 8.

Financial Statements and Supplementary Data

38

Report of Independent Registered Public Accounting Firm (PCAOB ID 238)

38

Consolidated Balance Sheets

40

Consolidated Statements of Operations

41

Consolidated Statements of Comprehensive Income

42

Consolidated Statements of Cash Flows

43

Consolidated Statements of Changes in Shareholders’ Equity

44

Notes to Consolidated Financial Statements

45

Item 9.

Changes in and Disagreements with Accountants on Accounting and Financial Disclosure

73

Item 9A.

Controls and Procedures

73

Item 9B.

Other Information

73

Part III.

Item 10.

Directors, Executive Officers, and Corporate Governance

74

Item 11.

Executive Compensation

74

Item 12.

Security Ownership of Certain Beneficial Owners and Management and Related Shareholder Matters

74

Item 13.

Certain Relationships and Related Transactions, and Director Independence

74

Item 14.

Principal Accountant Fees and Services

75

Part IV.

Item 15.

Exhibits and Financial Statement Schedules

75

Item 16.

Form 10-K Summary

75

Index to Exhibits

76

Signatures

79

2

Table of Contents

GLOSSARY

We use acronyms, abbreviations, and other defined terms throughout this Annual Report on Form 10-K, as defined in the glossary below:

Term

Definition

3.625% Senior Notes

TopBuild's 3.625% senior unsecured notes issued March 15, 2021 and due March 15, 2029

4.125% Senior Notes

TopBuild's 4.125% senior unsecured notes issued October 14, 2021 and due February 15, 2032

2015 LTIP

2015 Long-Term Incentive Program authorizes the Board to grant stock options, stock appreciation rights, restricted shares, restricted share units, performance awards, and dividend equivalents

2022 Repurchase Program

$200 million share repurchase program authorized by the Board on July 25, 2022

2024 Repurchase Program

$1 billion share repurchase program authorized by the Board on May 3, 2024

2025 Repurchase Program

$1 billion share repurchase program authorized by the Board on February 17, 2025

Amendment No. 4

Amendment No. 4 to the Credit Agreement dated July 26, 2023

Annual Report

Annual report filed with the SEC on Form 10-K pursuant to Section 13 or 15(d) of the Securities Exchange Act of 1934

ASC

Accounting Standards Codification

ASU

Accounting Standards Update

Best

Best Insulation Holdings LLC

Board

Board of Directors of TopBuild

BofA

Bank of America, N.A.

Brabble

Brabble Insulation, Inc.

CODM

Chief Operating Decision Maker

Credit Agreement

Amended and Restated Credit Agreement, dated March 20, 2020, among TopBuild, BofA as administrative agent, and the other lenders and agents party thereto

Current Report

Current report filed with the SEC on Form 8-K pursuant to Section 13 or 15(d) of the Securities Exchange Act of 1934

EBITDA

Earnings before interest, taxes, depreciation, and amortization

Exchange Act

The Securities Exchange Act of 1934, as amended

FASB

Financial Accounting Standards Board

Green Space

Nate's Insulation, LLC d/b/a Green Space Insulation

GAAP

Generally accepted accounting principles in the United States of America

Insulation Works

Insulation Works, Inc.

Lenders

Bank of America, N.A., together with the other lenders party to "Credit Agreement"

Metro

Metro Supply Co., LLC

Morris Black

Morris Black & Sons, Inc.

Net Leverage Ratio

As defined in the “Credit Agreement,” the ratio of outstanding indebtedness, less up to $100 million of unrestricted cash, to EBITDA

NYSE

New York Stock Exchange

PCI

Pest Control Insulation, LLC

Quarterly Report

Quarterly report filed with the SEC on Form 10-Q pursuant to Section 13 or 15(d) of the Securities Exchange Act of 1934

ROU

Right of use (asset), as defined in ASC 842

RSA  

Restricted stock award

SEC

United States Securities and Exchange Commission

Secured Leverage Ratio

As defined in the “Credit Agreement,” the ratio of outstanding indebtedness, including letters of credit, to EBITDA

Shannon

Shannon Global Energy Solutions, Inc.

SOFR

Secured overnight financing rate

SPI

SPI LLC d/b/a Specialty Products & Insulation

SRI

SRI Holdings, LLC

Term Loan

TopBuild's secured borrowings under the "Credit Agreement" due October 7, 2026

Term Facility Two

$550 million delayed draw term loan to be used to fund the future acquisition of SPI

Texas Insulation

EOAKIS, LLC, d/b/a Texas Insulation

TopBuild

TopBuild Corp. and its wholly-owned consolidated domestic subsidiaries

3

Table of Contents

SPECIAL NOTE REGARDING FORWARD-LOOKING STATEMENTS

Statements contained in this Annual Report that reflect our views about future periods, including our future plans and performance, constitute “forward-looking statements” under the Private Securities Litigation Reform Act of 1995.  Forward-looking statements can be identified by words such as “will,” “would,” “anticipate,” “expect,” “believe,” “designed,” “plan,” “may,” “project,” “estimate” or “intend,” the negative of these terms, and similar references to future periods.  These views involve risks and uncertainties that are difficult to predict and, accordingly, our actual results may differ materially from the results discussed in our forward-looking statements.  We caution you against unduly relying on any of these forward-looking statements.  Our future performance may be affected by the duration and impact of negative macro-economic impacts on the United States economy, specifically with respect to residential, commercial/industrial construction, our ability to collect our receivables from our customers, our reliance on residential new construction, residential repair/remodel, and commercial/industrial construction; our reliance on third-party suppliers and manufacturers; our ability to attract, develop, and retain talented personnel and our sales and labor force; our ability to maintain consistent practices across our locations; our ability to maintain our competitive position; and our ability to realize the expected benefits of our acquisitions.  We discuss the material risks we face under the caption entitled “Risk Factors” in Item 1A of this Annual Report.  Our forward-looking statements in this Annual Report speak only as of the date of this Annual Report.  Factors or events that could cause our actual results to differ may emerge from time to time and it is not possible for us to predict all of them.  Unless required by law, we undertake no obligation to update publicly any forward-looking statements as a result of new information, future events, or otherwise.

PART I

Item 1.  BUSINESS

Overview

TopBuild Corp., headquartered in Daytona Beach, Florida, is a leading installer and specialty distributor of insulation and other building material products to the construction industry in the United States and Canada.  On July 1, 2015, we began trading on the NYSE under the symbol “BLD.”

Segment Overview

We operate in two segments: our Installation segment, which accounts for approximately 62% of our sales, and our Specialty Distribution segment, which accounts for approximately 38% of our sales.  

We believe that having both Installation and Specialty Distribution provides us with a number of distinct competitive advantages.  First, the combined buying power of our two business segments, along with our scale, strengthens our ties to the major manufacturers of insulation and other building material products.  This enables us to buy competitively and ensures the availability of supply to our local branches and distribution centers.   The overall effect drives efficiencies throughout our supply chain.  Second, being a leader in both installation and specialty distribution allows us to reach a broader set of builders and contractors more effectively, regardless of their size or geographic location in the U.S. and Canada, and leverage housing and commercial/industrial construction growth regardless of location.  Third, during housing industry downturns, many insulation contractors who buy directly from manufacturers during industry peaks return to purchasing through specialty distributors.  As a result, this helps to reduce our exposure to cyclical swings in our business. 

Installation

We provide insulation installation services nationwide through our Installation segment which has approximately 250 branches located across the United States.

4

Table of Contents

Various insulation applications we install include:

Fiberglass batts and rolls
Blown-in loose fill fiberglass
Polyurethane spray foam
Blown-in loose fill cellulose

In addition to insulation products, which represented 80% of our Installation segment’s sales during the year ended December 31, 2024, we install other building products including, glass and windows, rain gutters, garage doors, closet shelving, and fireplaces, among other items.  

We handle every stage of the installation process including material procurement supplied by leading manufacturers, project scheduling and logistics, multi-phase professional installation, and installation quality assurance.    

Our Installation customer base includes national and regional single-family homebuilders, single-family custom builders, multi-family builders, commercial general contractors, remodelers, and individual homeowners.  

Specialty Distribution

We distribute building and mechanical insulation, insulation accessories, rain gutters and other building product materials for the residential and commercial/industrial end markets through our Specialty Distribution business. Insulation and insulation accessories, primarily fiberglass and spray foam, comprise approximately 89% of our Specialty Distribution sales.  We have approximately 170 distribution centers across the United States and 20 distribution centers in Canada. Our customer base consists of thousands of insulation contractors of all sizes serving a wide variety of residential and commercial/industrial industries, gutter contractors, weatherization contractors, other contractors, dealers, metal building erectors, and modular home builders.  

For further information on our segments, see Item 8. Financial Statements and Supplementary Data – Note 8. Segment Information.

Demand for Our Products and Services

Demand for our insulation products and services is driven by new single-family residential and multi-family home construction, commercial/industrial construction, residential remodel and repair activity, commercial/industrial maintenance and repair, and the growing need for more energy efficient homes, commercial structures, and industrial plants. The minimum amount of insulation installed in a new home or commercial project is regulated by various building and energy codes. Our leadership position in both insulation installation and specialty distribution allows us to reach a broader set of customers more effectively.  We recognize that competition for the installation and sale of insulation and other building material products occurs in localized geographic markets across the U.S. and Canada, and, as such, our operating model is based on empowering our geographically diverse branches that develop and maintain local customer relationships.  At the same time, our dispersed branches benefit from centralized functions such as purchasing, information technology, sales and marketing support, and accounting and finance.

Competitive Advantages

The market for the distribution and installation of building product materials is highly fragmented and competitive.  Barriers to entry for local competitors are relatively low, increasing the risk that additional competitors will emerge.  Our ability to maintain our competitive position depends on several factors including our scale, sales channels, diversified product lines, operational capabilities and strong local presence.

Scale.  Within our geographic footprint, we provide products and services to each major construction line of business in the U.S. and provide commercial/industrial products in Canada.  Our scale and local market presence combined with our various centralized corporate functions and corporate executive management team, enable us to successfully compete as we:

5

Table of Contents

Leverage systems, management, and best practice processes across both our Installation and Specialty Distribution businesses;

Provide national and regional home builders and commercial/industrial general contractors with broad geographic reach, while maintaining consistent policies and practices that enable reliable, high-quality products and services across many geographies and building sites;

Provide designers and installers of mechanical systems for commercial/industrial buildings, technical knowledge and expertise, and value-add fabrication services;

Leverage our strong ties to major manufacturers of insulation and other building products to help ensure we are buying competitively, maintaining our supply to our local branches and distribution centers, and driving efficiencies throughout our supply chain;

Provide consistent, customized support and geographic coverage to our customers; and

Maintain an operating capacity that allows us to ramp-up rapidly, without major incremental investment, to target forecasted growth in housing starts and construction activity in each of our lines of business throughout the U.S. and Canada.

Two avenues to reach builders and contractors.  We believe that having both installation and specialty distribution businesses provides many advantages to reaching our customers.  Our Installation business customer base includes builders of all sizes.  Our branches go to market with the local brands that regional and custom builders recognize and value, and our national footprint is appealing to large builders who value consistency across a broad geography.  Our Specialty Distribution business focuses on selling to small contractors who generally have strong local relationships with smaller custom builders and general contractors, and to industrial general contractors and facilities requiring customized solutions on a recurring basis.  We believe that being a leader in both installation and specialty distribution allows us to more effectively reach a broader set of builder customers and contractors, regardless of their size or geographic location within the U.S. and Canada, and leverage new construction housing, and commercial/industrial growth, wherever it occurs.

Diversified lines of business.  In response to previous housing market downturns and to mitigate the cyclicality of residential new home construction, we expanded and enhanced our ability to serve the commercial/industrial construction markets.  This included expanding our commercial/industrial operations and sales capacity, adding commercial/industrial product offerings, developing relationships with commercial/industrial general contractors, and building our expertise and reputation for quality service for both light and heavy commercial/industrial construction projects. Although commercial/industrial construction is affected by many of the same macroeconomic and local economic factors that drive residential new construction, commercial/industrial construction has historically followed different cycles than residential new construction. 

Strong local presence.  Competition for the installation and sale of insulation and other building material products to builders occurs in localized geographic markets throughout the U.S. and Canada.  Builders and contractors in each local market have the ability to choose among several insulation installers and specialty distributors they value their projects, and for local relationships, quality, and timeliness.  Our Installation branches are locally branded businesses that are recognized within the communities in which they operate.  For residential housing, our Specialty Distribution centers service primarily local contractors, lumberyards, retail stores and others who, in turn, service local homebuilders and other customers.  For commercial/industrial mechanical insulation, we primarily service mechanical insulation installers, general contractors and end-users across diverse industries such as oil and gas, liquefied natural gas, data centers, food and beverage, and pharmaceuticals and biotech.  In addition, we provide industrial customers with mechanical insulation for maintenance and repair operations which must be performed on a scheduled basis as mechanical insulation is often exposed to extreme temperatures.  Our operating model, in which individual branches and distribution centers maintain local customer relationships, enables us to develop local, long-tenured relationships with these customers, build local reputations for quality, service and timeliness, and provide specialized products and personalized services tailored to a geographic region or customer.  At the same time, our local operations benefit from centralized functions, such as purchasing, information technology, sales support, and accounting and finance, and the resources and scale efficiencies of an installation and distribution business that has a presence across the U.S. and Canada.

6

Table of Contents

Unique ability to offset decreases in demand for services with our Specialty Distribution business.  During industry downturns many insulation contractors, who buy directly from manufacturers during industry peaks, return to purchasing through distributors for smaller shipments, less than a full truckload. This tends to drive incremental customers to our Specialty Distribution business, which can help offset a decrease in demand for installation services in our Installation business during market slowdowns.  We believe that our leadership position in both installation and specialty distribution businesses helps to reduce exposure to cyclical swings in our lines of business.

Strong cash flow and favorable working capital fund organic growth.  Over the last several years, we have reduced fixed costs and improved our labor utilization.  As a result, we can achieve profitability at lower levels of demand as compared to historical periods.  For further discussion on our cash flows and liquidity, see Item 7. Management’s Discussion and Analysis of Financial Condition and Results of Operations – Liquidity and Capital Resources.

Major Customers

We have a diversified portfolio of customers.  Our top customer accounted for approximately four percent of our total revenues for the year ended December 31, 2024.  Our top ten customers accounted for approximately 12 percent of our total sales in 2024.  

Suppliers

Our businesses depend on our ability to obtain an adequate supply of high-quality products and components from manufacturers and other suppliers.  We source the majority of our fiberglass building products from four primary U.S.-based residential fiberglass insulation manufacturers: CertainTeed, Johns Manville, Knauf, and Owens Corning.  Failure by our suppliers to provide us with an adequate supply of high-quality products on commercially reasonable terms, or to comply with applicable legal requirements, could have a material, adverse effect on our financial condition or operating results.  We have positive relationships with our suppliers and work diligently with them to ensure the quality of materials.  Our current business model with material suppliers affords us flexibility in maximizing material purchasing, which is often driven by region, demand, supply, and pricing, without the constraints of exclusivity agreements.

Human Capital

As a leading installer of insulation and specialty distributor of insulation and building material products to the construction industry in the U.S. and Canada, our performance relies heavily on human capital and relationships with customers and suppliers.  Accordingly, our success depends on our ability to attract, retain, protect, and develop our employees.  To support these objectives, we have designed and implemented a human capital management program that fosters a culture of inclusivity, collaboration, support, and innovation where every voice is welcome, heard, and respected.

Employee Recruiting & Retention

As of December 31, 2024, we had 13,984 employees (excluding contingent workers), of which 8,394 were installers.  714 of our employees were covered by 47 collective bargaining agreements that expire on various dates through 2027.  We believe that our relationships with our union partners are good.

To attract and retain experienced employees, we offer a positive culture and competitive compensation, benefits, and development programs to all our employees.  Our benefits and development programs are designed to meet the needs of a diverse employee workforce and include tuition reimbursement, career growth and professional development opportunities and tools, matching 401(k) contributions, multiple dental and medical plan options, and paid time off.  

We take proactive steps to find quality sources of construction labor and our Friends and Family Referral Program remains a key source for recruiting and retaining installers.  This program has been very successful since its launch in 2020, and in 2024 led to the hiring and retention of 1,192 installers.  In addition, we hire directly from the local communities in which our branches operate, and we partner with organizations that help source talent with diverse backgrounds, including organizations in support of veterans, refugees, and trade school students and graduates.

7

Table of Contents

Voluntary turnover across all employee categories in 2024 was 24.7%, which is an improvement from our 2023 turnover rate of 30%. We attribute our effective retention rate to a positive employee experience featuring competitive wages, comprehensive benefits, meaningful work, and a sense of belonging and purpose.

Employee Development

To build a pipeline of leadership talent, we recruit internally and externally into our Manager in Training (MIT) program, which is designed to foster the development of participants into leaders across our Company.  The program lasts 12-20 months and participants are supported by our executive management team as they are immersed in all aspects of our operations and directly serve and support our customers and suppliers.  Upon completion, successful participants are regularly promoted into branch leadership roles within our Company.  Participants enter the MIT program on a rolling basis and in 2024 we had an average of 25-30 participants in the program at any given time, which is the highest in our Company’s history.

Additionally, in 2024 we introduced the Leadership Academy, which features two key leadership courses: Foundations of Leadership and Advanced Leadership Principles.  Participants are nominated by the Company’s senior leaders and take part in a 6-month program teaching inspirational leadership, personal leadership awareness, team management, people development, leadership skills, and the importance of high performing teams. The Leadership Academy aligns with TopBuild’s core values and leadership expectations and is designed to promote both personal and organizational growth.

Workforce Diversification

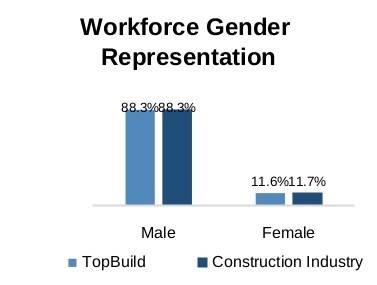
As of December 31, 2024, our employees self-identified as 46.8% Hispanic, 34.1% White, 7.4% Black, 3.8% Other or Multi Race, and 7.8% Undisclosed.  Our employees represent a higher racial diversification than both the construction industry average and the total U.S. workforce, as reported by the Bureau of Labor Statistics (December 2024).  In addition, our workforce self-identifying as female as of December 31, 2024, was 11.6%, which is in line with the U.S. construction industry female workforce, as reported by the Bureau of Labor Statistics (December 2024).  Our corporate leadership team (managers and above) self-identified as approximately 37.7% female, and of all leaders (managers and above) 28.3% identify as non-white or undisclosed.

Graphic

Graphic

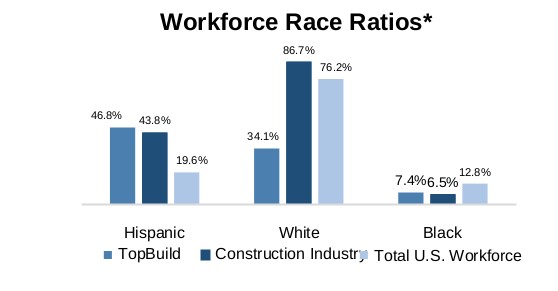
*Sums to greater than or less than 100% due to multi-racial reporting.

We acknowledge and are committed to respecting and upholding the human rights and dignity of all individuals within our operations.  We have adopted a company-wide Human Rights policy, which is designed to promote a workplace that values and respects the contributions and perspectives of all employees from a variety of backgrounds, skills, and experiences.  Company policies, including the Human Rights Policy, are published in the ESG section of our website.

8

Table of Contents

Safety

We prioritize a culture of safety that innovates better and safer ways to work, emphasizes best practices, and rewards ongoing improvement in our safety performance.  We believe our focus on safety is a key differentiator in our industry, and it is an important indicator in how we measure our Company’s success.

To achieve continuous improvement in safety, we provide our employees with ongoing safety training, information, and programs.  Training commences upon employee onboarding and continues with regular sessions delivered throughout the year.  All new hires must complete our standard safety curriculum and we require a minimum number of annual training hours thereafter.  We provide training sessions in-person, online or on-demand, with specific training assigned by job and work scope.  All safety training programs are available in the employee’s preferred language and attending employees are evaluated for understanding through written, verbal, and skill-based assessments.  During 2024, we assigned each of our employees an average of 13.0 hours of safety training.

To align our workforce with our safety goals, a portion of our annual incentive compensation for all eligible employees, including our senior leadership, is tied to our safety performance.  While we ultimately strive to have zero incidents, we set an aggressive annual target based on prior year performance as compared against industry average at the company level and for each business segment.  Further, our regional Safety Managers audit field locations and our Branch Support Center to assess compliance with our policies and procedures.

We closely monitor injury trends and conduct extensive research to better understand and improve our safety performance.  In 2024, we experienced no fatalities.  Our company-wide injury rate was 1.95 and our lost time case rate was 0.61, each of which is significantly below the industry average of 3.6 and 1.5, respectively, as reported by the Bureau of Labor and Statistics for NAICS 23831 (2023).  Our incident rates do not include the impact of acquired companies in the year of acquisition.

Graphic

Graphic

Community Involvement  

TopBuild has a longstanding commitment to making a positive impact on the communities in which we live and work. Through our affiliate partnerships, we support initiatives that create positive and lasting improvements in these communities:

Habitat for Humanity: Our 2024 Habitat for Humanity Golf Tournament was our largest event ever, raising a total of $1.0 million. Since 2016, TopBuild and its supplier partners have contributed nearly $5.0 million to help Habitat for Humanity realize its vision of providing families with safe and affordable housing.  Alongside monetary donations, TopBuild and its employees have provided material donations, countless volunteer hours, and attended numerous dedication ceremonies to celebrate families and their entry into home ownership. Together, TopBuild and Habitat for Humanity have helped build better lives, strengthening our communities one family at a time.

9

Table of Contents

NASCAR Foundation: In 2024, TopBuild continued its partnership with the NASCAR Foundation and was a primary sponsor of their Speedy Bear Brigade initiative, which provided 4,000 pediatric patients across the country with a teddy bear, other toys, and a personalized ‘Get Well Soon’ card, making their hospital stays more comfortable.

Payit4ward: TopBuild sponsored Payit4ward’s annual summer Back to School Drive by donating over 2,000 backpacks for the event. In partnership with other volunteers from the community, our employees helped fill the backpacks with school supplies, ensuring thousands of underserved children were prepared and excited for their first day of school.

American Red Cross: In 2024, TopBuild donated $25,000 to the American Red Cross to help provide aid to families impacted by storms and other natural disasters.

Sophie’s Circle: In 2024, TopBuild employees helped raise $5,000 to provide food, shelter, and medical care to animals in our community.

Salvation Army: TopBuild is an active supporter of the Salvation Army and their Angel Tree program. In 2024, our employees purchased holiday gifts for 75 children, along with providing financial support to help the Salvation Army offer humanitarian aid to individuals and families in need throughout the year.

Employee Engagement

Employee feedback and engagement are critical as we continue to foster a positive work environment and employee experience. In addition to new-hire and exit surveys, we conduct all-employee engagement surveys administered by a third party. The most recent survey took place in 2023 and 60% of our employees responded. We are proud that our engagement index score was 85%, representing positive feedback on questions related to pride in our Company, a sense of accomplishment, and an intent to stay. We shared the results of our survey with our employees, leadership at all levels and locations, and with our Board. While the survey results were positive, we understand that we must continue to listen to our employees and prioritize action in areas of improvement identified by the survey respondents.

In 2024, TopBuild was certified as a Great Place to Work® for the second consecutive year. This two-step certification process includes employee feedback to a third-party survey and a questionnaire about the workforce and culture. We are proud to report that 81% of our surveyed employees say that TopBuild is a great place to work, as compared to 57% of employees at a typical U.S. based company. (Source: Great Place To Work® 2021 Global Employee Engagement Study.)

TopBuild was also named to Forbes’ America’s Best Companies 2025 inaugural list.  This is Forbes’ most comprehensive company ranking, assessing thousands of U.S.-headquartered public companies against more than 60 metrics and 11 primary categories to identify the top 300 companies that excel across the board.  The measured categories include financial strength, employee and customer sentiment, and workforce stability. TopBuild is proud of this recognition of our growth and success.

We believe each employee plays an important role in creating a culture of belonging and an environment where we can thrive, and we look forward to celebrating these achievements and working to ensure that TopBuild remains an excellent place to work.

Executive Officers

Set forth below is information about our executive officers. There are no family relationships among any of the officers named below.

Robert M. Buck, age 55

Chief Executive Officer and President since January 1, 2021
President and Chief Operating Officer from June 2015 – December 2020

10

Table of Contents

Group Vice President of Masco from 2014 – June 2015, responsible for the Installation and Other Services Segment consisting of both Masco Contractor Services and Specialty Distribution
President of Masco Contractor Services from 2009 – 2014

Robert M. Kuhns, age 51

Vice President and Chief Financial Officer since March 2022
Vice President, Controller from July 2018 – March 2022
Senior Director, Assistant Corporate Controller of Mohawk Industries, Inc. from July 2015 – July 2018
Senior Director, International Finance of Mohawk Industries, Inc. from March 2013 – July 2015

Luis F. Machado, age 62

Vice President, General Counsel and Corporate Secretary since August 2020
Vice President, General Counsel and Secretary of CTS Corporation from 2015 – August 2020
Senior Vice President, Legal, and Assistant Secretary of L Brands, Inc. from 2010 – 2015

Jennifer J. Shoffner, age 52 

Chief Human Resources Officer since August 2020
Vice President, Talent Management from February 2020 – August 2020
Vice President, Human Resources of Liberty Hardware, a Masco Company, from 2006 – 2011 and 2013 – January 2020

Joseph M. Viselli, age 57

Vice President and Chief Growth Officer since October 2024
Vice President and Chief Operating Officer from October 2022 – October 2024
Senior Vice President and General Manager of Distribution International from June 2020 – October 2022
Senior Vice President and General Manager of Silvercote from June 2019 – October 2022
General Manager of Silvercote and Senior Vice President of Knauf Insulation from February 2017 – June 2019

Steven P. Raia, age 69

President, TopBuild Special Operations and Executive Adviser since January 2024
President, TruTeam Operations from March 2019 – January 2024
Senior Vice President of Operations, from November 2015 – March 2019
Various operations management and roles in insulation businesses prior to 2015

Jeffrey M. Krestancic, age 41

President, TruTeam since January 2024
Senior Vice President, TruTeam Operations from May 2023 – January 2024
Vice President, TruTeam Operations from July 2021 to May 2023
Regional Director, TruTeam from April 2017 to July 2021
Various operations management and roles in insulation business prior to April 2017

11

Table of Contents

Legislation and Regulation

We are subject to U.S. and Canadian federal, state, provincial, and local laws and regulations, particularly those pertaining to health and safety (including protection of employees and consumers), labor standards/regulations, contractor licensing, and environmental matters.  In addition to complying with currently effective legal requirements and preparing for upcoming requirements, even more stringent legal requirements could be imposed on our industries.  Additionally, some of our products and services require certification by industry or other organizations. Maintaining compliance with potentially changing legal requirements and industry standards may require us to alter our specialty distribution and installation processes and our sourcing, which could adversely impact our business.  Further, as discussed in our Item 1A (Risk Factors), if we do not effectively and timely comply with legal requirements and industry standards, our operating results could be negatively affected.

Additional Information

We provide our Annual Reports, Quarterly Reports, Current Reports and amendments to those reports free of charge on our website, www.topbuild.com, as soon as reasonably practicable after these reports are filed with or furnished to the SEC.  We also provide information relating to our policies and practices, and safety metrics, on our website.  Information contained on our website is not incorporated by reference into this Form 10-K, and you should not consider information contained on our website to be part of this Form 10-K or in deciding whether to purchase shares of our common stock.

Use of our Website to Distribute Company Information

We use our website, www.topbuild.com, as a channel of distribution and routinely post important Company information including press releases, investor presentations and financial information. We may also use our website to expedite public access to time-critical information regarding our Company in advance of or in lieu of distributing a press release simultaneously with a filing with the SEC disclosing the same information. Visitors to our website can also register to receive automatic e-mail and other notifications alerting them when new information is made available.

12

Table of Contents

Item 1A. RISK FACTORS

A number of risks and uncertainties could affect our business and cause our actual results to differ from past performance or expected results.  We consider the following risks and uncertainties to be those material to our business.  If any of these risks occur, our business, financial condition and results of operations could suffer, and the trading price of our common stock could decline.  We urge investors to carefully consider the risk factors described below in evaluating the information contained in this Annual Report.  

Risks Which May Be Material to Our Business

Risks Relating to Products and Supply Chain

We are dependent on third-party suppliers and manufacturers to provide us with an adequate supply of high-quality products, and the loss of a large supplier or manufacturer could negatively affect our operating results.

Failure by our suppliers to provide us with an adequate supply of high-quality products on commercially reasonable terms, or to comply with applicable legal requirements, could have a material adverse effect on our financial condition or operating results. While we believe that we have positive relationships with our suppliers, the fiberglass insulation industry has encountered both shortages and periods of significant oversupply during past housing market cycles, leading to volatility in prices and allocations of supply, which affect our results. Fiberglass insulation has been on allocation for significant periods in the recent past through the date of this Annual Report. While we do not believe we depend on any sole or limited source of supply, we source the majority of our building products, primarily insulation, from a limited number of large suppliers.  The loss of a large supplier, or a substantial decrease in the availability of products or components from our suppliers for any reason, could disrupt our business and adversely affect our operating results.

Our profit margins could decrease due to changes in the costs of the products we install and/or distribute.

The principal building products that we install and distribute have been subject to price changes in the past, some of which have been significant.  Our results of operations for individual quarters can be, and have been, hurt by a delay between the time product or material cost increases are implemented and the time we are able to increase prices for our installation or specialty distribution services, if at all.  Our supplier purchase prices may depend on our purchasing volume or other arrangements with any given supplier. While we have been able to achieve cost savings through volume purchasing or other arrangements with suppliers in the past, we may not be able to consistently continue to receive advantageous pricing for the products we distribute and install.  If we are unable to maintain purchase pricing consistent with prior periods or are unable to pass on price increases, our costs could increase and our margins may be adversely affected.

The development of alternatives to distributors in the supply chain could cause a decrease in our sales and operating results and limit our ability to grow our business.

Our Specialty Distribution customers could begin purchasing more of their products directly from manufacturers, which would result in decreases in our net sales and earnings.  Our suppliers could invest in infrastructure to expand their own local sales force and sell more products directly to our Specialty Distribution customers, which also would negatively impact our business. In addition, our Specialty Distribution customers could expand their on-site fabrication and customization activities, negatively impacting demand for our value added fabrication services.

New product innovations or new product introductions could negatively impact our business. 

New product innovations or new product introductions could negatively impact demand for the products we install and distribute.

13

Table of Contents

Issues with product quality or performance could negatively impact our business.

Our business depends on high-quality products from manufacturers and other suppliers, and issues with the quality or performance of such products could negatively impact our business.  While we are generally indemnified by our manufacturers and suppliers for claims relating to the quality of their products, our business could be negatively impacted by product quality or performance issues, including exposure to legal claims and regulatory proceedings and damage to our reputation.

We may not be able to identify new products or new product lines and integrate them into our specialty distribution or installation network, which may impact our ability to compete.  Our expansion into new markets may present competitive, distribution, installation, and regulatory challenges that differ from current ones.

Our business depends, in part, on our ability to identify future products and product lines that complement existing products and product lines and that respond to our customers’ needs. We may not be able to compete effectively unless our product selection keeps up with trends in the markets in which we compete, or trends in new products, which could cause us to lose market share. Our expansion into new markets, new products, or new product lines may present competitive, distribution, installation, and regulatory challenges, as well as divert management’s attention away from our core business. In addition, the inability to integrate new products and product lines into our specialty distribution or installation network could affect our ability to compete.

Risks Relating to Events Beyond Our Control

A decline in general economic conditions could materially reduce demand for our services or the products that we distribute.

Demand for our products and services depends heavily on the operating level of our customers and the economic factors that affect them, including general economic conditions and the financing and interest rate environment. In a recession or economic downturn, our customers may materially reduce construction or industrial activities because of lower consumer demand, which in turn will decrease their need for our services and the products that we distribute. Further, periods during which interest rates remain elevated, or are perceived or expected to remain elevated, may dampen demand in the housing or construction markets that we serve or negatively impact our stock price. Volatile economic and credit conditions and elevated interest rates also make it more difficult for our customers to forecast and plan future business activities and may prevent them from ordering our products or services as frequently or in the quantities they otherwise would. We may experience materially adverse impacts to our business because of any economic recession, slowing in the rate of growth, interest rate changes, or other economic factors negatively affecting affordability of residential housing or commercial construction.

An epidemic, pandemic, or similar serious public health issue (such as COVID-19), and the measures undertaken by governmental authorities to address it, may cause business and market disruptions, impacting demand for our services or the products we distribute, our ability to provide services, or our results of operations or financial condition.

The spread of highly infectious or contagious diseases (such as COVID-19) could cause quarantines, business shutdowns, reduction in business activity and financial transactions, labor shortages, supply chain interruptions, and overall economic and financial market instability, all of which may impact general economic conditions or consumer confidence. To the extent that economic activity, business conditions, and the industries in which we operate deteriorate as a result of such disruptions, we would expect to experience an adverse impact on demand for our services and the products we distribute, our ability to provide services, or our results of operations or financial condition.

Our business may be adversely affected by economic, political and social conditions and events in North America or other regions where we may not operate. 

We operate primarily in North America, but also supply projects in other parts of the world and have suppliers and customers that have operations outside of North America. Our business is subject to risks arising from economic, political, and social conditions and events in any of these regions, such as recessions, inflation, deflation, currency fluctuations, trade disputes, wars, terrorist attacks, pandemics, natural disasters, and other crises. These conditions and events may affect the demand for our services and products, the availability and cost of materials and labor, the financial condition and creditworthiness of our customers and suppliers, the stability and regulation of financial markets, the ability to raise capital, the enforcement of contractual obligations, the protection of intellectual property rights, and the conduct of business operations. Any of these factors could have a material adverse effect on our business, results of operations, and financial condition. 

14

Table of Contents

Risks Relating to Human Capital

The long-term performance of our businesses relies on our ability to attract, develop, and retain talented personnel, including sales representatives, branch managers, installers, and truck drivers, while controlling our labor costs.

We are highly dependent on the skills and experience of our senior management team and other skilled and experienced personnel.  The failure to attract and retain key employees could negatively affect our competitive position and operating results.

Our business results also depend upon our branch managers and sales personnel, including those of businesses acquired.  Our ability to control labor costs and attract qualified labor is subject to numerous external factors including prevailing wage rates, the labor market, the demand environment, the impact of legislation or regulations governing wages and hours, labor relations, immigration, healthcare benefits, and insurance costs.  In addition, we compete with other companies to recruit and retain qualified installers, truck drivers, warehouse workers, and other laborers in a tight labor market, and we invest significant resources in training and motivating them to maintain a high level of job satisfaction.  These positions generally have high turnover rates, which can lead to increased training and retention costs. If we fail to attract qualified labor on favorable terms, we may not be able to meet the demand of our customers, which could adversely impact our business, financial condition, and results of operations.

Changes in employment and immigration laws and regulations may adversely affect our business.

Various federal and state labor laws and regulations govern the relationship with our employees and impact operating costs.  These laws include, but are not limited to, employee classification as exempt or non-exempt for overtime and other purposes; workers’ compensation rates; immigration status; mandatory health benefits; tax reporting; and other wage and benefit requirements. We have significant exposure to changes in laws governing our relationships with our employees, including wage and hour laws and regulations, fair labor standards, minimum wage requirements, overtime pay, unemployment tax rates, workers’ compensation rates, citizenship requirements, payroll taxes, and the enforcement of non-competition agreements, as well as vaccination and testing mandates which may be imposed in connection with the occurrence of pandemic or health concerns, which changes would have a direct impact on our operating costs.  Significant additional government-imposed increases in the preceding laws, regulations, or requirements could have a material adverse effect on our business, financial condition, and results of operations.

In addition, certain states in which we operate are considering or have already adopted new immigration laws or enforcement programs, and the U.S. Congress and Department of Homeland Security from time to time considers and implements changes to federal immigration laws, regulations, or enforcement programs.  These changes may increase our compliance and oversight obligations or cause labor shortages or challenges in hiring labor, which could subject us to additional costs and make our hiring process more cumbersome, or reduce the availability of potential employees. Although we verify the employment eligibility status of all our employees, including through participation in the “E-Verify” program where required, some of our employees may, without our knowledge, be unauthorized workers.  Use of the verification tools and/or “E-Verify” program does not guarantee that we will properly identify all applicants who are ineligible for employment.  Unauthorized workers are subject to deportation and may subject us to fines or penalties and, if any of our workers are found to be unauthorized, we could experience adverse publicity that negatively impacts our brand and may make it more difficult to hire and retain qualified employees, which could disrupt our operations.  We could also become subject to fines, penalties, and other costs related to claims that we did not fully comply with all recordkeeping obligations of federal and state immigration laws. Changes to immigration laws may have an indirect impact on our business if other construction trades are impacted, potentially lengthening the construction cycle or increasing competition for labor. These factors could have a material adverse effect on our business, financial condition, and results of operations.

15

Table of Contents

Union organizing activity and work stoppages could delay or reduce the availability of products that we install and increase our costs.

As of December 31, 2024, 714 of our employees were covered by 47 collective bargaining agreements that expire on various dates through 2027.  Any inability by us to negotiate collective bargaining arrangements could cause strikes or other work stoppages, and new contracts could result in increased operating costs.  If any such strikes or other work stoppages occur, or if other employees become represented by a union, we could experience a disruption of our operations and higher labor costs.  Further, if a significant number of additional employees were to unionize, including in the wake of any future legislation or regulation that makes it easier for employees to unionize, these risks would increase.  In addition, certain of our suppliers have unionized work forces, and certain of the products we install and/or distribute are transported by unionized truckers.  Strikes, work stoppages, or slowdowns could result in slowdowns or closures of facilities where the products that we install and/or distribute are manufactured, or could affect the ability of our suppliers to deliver such products to us.  Any interruption in the production or delivery of these products could delay or reduce availability of these products and increase our costs.

Our business relies significantly on the expertise of our employees and we generally do not have intellectual property that is protected by patents.

Our business is significantly dependent upon our expertise in installation and distribution logistics, and the application of building science.  We rely on a combination of trade secrets and contractual confidentiality provisions and, to a much lesser extent, copyrights and trademarks, to protect our proprietary rights.  Accordingly, our intellectual property is more vulnerable than it would be if it were protected primarily by patents.  We may be required to spend significant resources to monitor and protect our proprietary rights, and in the event a misappropriation or breach of our proprietary rights occurs, our competitive position in the market may be harmed.  In addition, competitors may develop competing technologies and expertise that renders our expertise obsolete or less valuable.

Risks Relating to Mergers and Acquisitions

We may not be successful in identifying and making acquisitions.

We have made, and in the future may continue to make, strategic acquisitions as part of our growth strategy.  We may be unable to make accretive acquisitions or realize expected benefits of any acquisitions for any number of reasons including, but not limited to:

failure to identify attractive targets in the marketplace;
increased competition for attractive targets;
incorrect assumptions regarding the future results of acquired operations or assets, expected cost reductions, or other synergies expected to be realized as a result of acquiring operations or assets;
failure to obtain acceptable financing or required clearance or approvals; or
restrictions in our debt agreements.

Acquisition integrations involve risks that could negatively affect our operating results, cash flows, and liquidity.

Our ability to successfully implement our business plan and achieve targeted financial results is dependent on our ability to successfully integrate acquired businesses.  The process of integrating acquired businesses, may expose us to operational challenges and risks, including, but not limited to:

the ability to profitably manage acquired businesses or successfully integrate the acquired business’ operations, financial reporting, and accounting control systems into our business;
the expense of integrating acquired businesses;
increased indebtedness;
the loss of installers, suppliers, customers or other significant business partners of acquired businesses;
potential impairment of goodwill and other intangible assets;
risks associated with the internal controls and accounting policies of acquired businesses;
diversion of management’s attention due to the increase in the size of our business;

16

Table of Contents

the ability to fund cash flow shortages that may occur if anticipated revenue is not realized or is delayed, whether by general economic or market conditions, or unforeseen internal or external difficulties;
the availability of funding sufficient to meet increased capital needs;
difficulties in the assimilation of different corporate cultures and business practices;
the inability to retain vital employees or hire qualified personnel required for expanded operations;
failure to identify all known and contingent liabilities during due diligence investigations; and
the insufficiency of indemnification granted to us by sellers of acquired companies.

Failure to successfully integrate any acquired business may result in reduced levels of revenue, earnings, or operating efficiency than might have been achieved if we had not acquired such business.  In addition, our past acquisitions’ results, and any future acquisitions could result in the incurrence of additional debt and related interest expense, contingent liabilities, and amortization expenses related to intangible assets, which could have a material adverse effect on our financial condition, operating results, and cash flow.  

We may not be able to achieve the benefits that we expect to realize as a result of future acquisitions.  Failure to achieve such benefits could have an adverse effect on our financial condition and results of operations.

We may not be able to realize anticipated cost savings, revenue enhancements, or other synergies from future acquisitions, either in the amount or within the time frame that we expect.  In addition, the costs of achieving these benefits may be higher than, and the timing may differ from, what we expect.  Our ability to realize anticipated cost savings, synergies, and revenue enhancements may be affected by a number of factors, including, but not limited to, the following:

the use of more cash or other financial resources on integration and implementation activities than we expect;
unanticipated increases in expenses unrelated to any future acquisition, which may offset the expected cost savings and other synergies from any future acquisition;  
our inability to eliminate duplicative back office overhead and redundant selling, general, and administrative functions; and
our inability to avoid labor disruptions in connection with the integration of any future acquisition, particularly in connection with any headcount reduction.  

While we expect future acquisitions to create opportunities to reduce our combined operating costs, these cost savings reflect estimates and assumptions made by our management, and it is possible that our actual results will not reflect these estimates and assumptions within our anticipated timeframe or at all.  

If we fail to realize anticipated cost savings, synergies, or revenue enhancements, our financial results may be adversely affected, and we may not generate the cash flow from operations that we anticipate.  

Risks Relating to Legal and Regulatory Matters

Because we operate our business through highly dispersed locations across the U.S. and Canada, our operations may be materially adversely affected by inconsistent local practices, and the operating results of individual branches and centers may vary.

We operate our business through a network of highly dispersed locations throughout the United States and Canada, supported by executives and services at our Branch Support Center in Daytona Beach, Florida, with local branch management retaining responsibility for day-to-day operations and adherence to applicable local laws.  Our operating structure can make it difficult for us to coordinate procedures across our operations.  In addition, our branches and distribution facilities may require significant oversight and coordination from headquarters to support their growth.  Inconsistent implementation of corporate strategy and policies at the local or regional level could materially and adversely affect our business, financial condition, results of operations, and cash flows.

17

Table of Contents

Claims and litigation could be costly.

We are, from time to time, involved in various claims, litigation matters, and regulatory proceedings that arise in the ordinary course of our business and which could have a material adverse effect on us.  These matters may include contract disputes, automobile liability and other personal injury claims, warranty disputes, construction defect, environmental claims or proceedings, other tort claims, employment and tax claims, claims relating to the quality of products sourced from our suppliers, and other proceedings and litigation, including class actions.  In addition, we are exposed to potential claims by our employees or others based on job-related hazards.  

We may also be subject to claims or liabilities arising from our acquisitions for the periods prior to our acquisition of them, including environmental, employee-related, and other liabilities and claims not covered by insurance. Our ability to seek indemnification from the former owners of our acquired businesses for these claims or liabilities may be limited by the respective acquisition agreements and the financial ability of the former owners to satisfy our indemnification claims.

Our builder and contractor customers are subject to product liability, casualty, negligence, construction defect, breach of contract, warranty, and other claims in the ordinary course of their business. Our contractual arrangements with our builder and contractor customers may include our agreement to defend and indemnify them against various liabilities.

We rely on manufacturers and other suppliers to provide us with most of the products we install and distribute.  Because we do not have direct control over the quality of products manufactured or supplied by third-party suppliers, we are exposed to risks relating to the quality of those products.  In addition, we are exposed to potential claims arising from the conduct of our employees, homebuilders, and other subcontractors, for which we may be liable contractually or otherwise.

Product liability, workmanship warranty, casualty, negligence, construction defect, breach of contract, and other claims and legal proceedings can be expensive to defend and can divert the attention of management and other personnel for significant periods of time, regardless of fault or the ultimate outcome.  In addition, lawsuits relating to construction defects typically have statutes of limitations that can run as long as ten years.  Claims of this nature could also have a negative impact on customer confidence in us and our services.  

Although we intend to defend all claims and litigation matters vigorously, given the inherently unpredictable nature of claims and litigation, we cannot predict with certainty the outcome or effect of any claim or litigation matter.

We expect to maintain insurance against some, but not all, of our risks of loss resulting from claims and litigation.  We may elect not to obtain insurance if we believe the cost of available insurance is excessive relative to the risks presented.  The levels of insurance we maintain may not be adequate to fully cover any and all losses or liabilities.  If any significant accident, judgment, claim, or other event is not fully insured or indemnified against, it could have a material adverse impact on our business, financial condition, and results of operations.

Compliance with government regulation and industry standards could impact our operating results.

We are subject to national, state, provincial, and local government regulations, particularly those pertaining to health and safety, including protection of employees and consumers, employment laws, including immigration and wage and hour regulations, contractor licensing, data privacy, cybersecurity, and climate and environmental laws and regulations.  In addition to complying with current requirements, even more stringent requirements could be imposed in the future by the Securities and Exchange Commission and other governmental authorities, or by the states and provinces in which we operate.  Compliance with these regulations and industry standards is costly and may require us to invest additional resources into our compliance infrastructure, thereby increasing our cost structure.  We may also be required to alter our installation and distribution processes, product sourcing, or business practices, which could make recruiting and retaining labor in a tight labor market more challenging.   If we do not effectively and timely comply with such regulations and industry standards, our results of operations could be negatively affected, and we could become subject to substantial penalties or other legal liability.

18

Table of Contents

We are subject to environmental regulation and potential exposure to environmental liabilities.

We are subject to various federal, state, provincial, and local environmental laws and regulations. Although we believe that we operate our business, including each of our locations and acquired businesses, in compliance with applicable laws and regulations and maintain all material permits required under such laws and regulations to operate our business, we may be held liable or incur fines or penalties in connection with such requirements. In addition, environmental laws and regulations, including those related to energy use and climate change, may become more stringent over time, and any future laws and regulations could have a material impact on our operations or require us to incur material additional expenses to comply. We may be subject to environmental claims or liabilities arising from the ownership or operation of acquired businesses for the periods prior to our acquisition. If we are unable to successfully obtain insurance coverage or enforce our indemnification rights against the former owners regarding such liabilities or claims, or if the former owners are unable to satisfy their obligations for any reason, we could be held liable for such liabilities or claims, which could adversely affect our financial condition and results of operations.

Changes in building codes and consumer preferences could affect our ability to market our service offerings and our profitability.  Moreover, if we do not respond to evolving customer preferences or changes in building standards, or if we do not maintain or expand our expertise in building science, our business, results of operation, financial condition, and cash flow would be adversely affected.

Each of our lines of business is impacted by building codes and consumer preferences, including a focus on energy efficiency.  Our competitive advantage is due, in part, to our ability to respond to changes in consumer preferences and building codes.  However, if our installation and distribution services and our expertise in building sciences do not adequately or quickly adapt to changing preferences and building standards, we may lose market share to competitors, which would adversely affect our business, results of operation, financial condition, and cash flows.  Further, our growth prospects could be harmed if consumer preferences and building standards do not evolve towards more energy efficient service offerings, which tend to increase demand for our service offerings.  

Risks Relating to the Industry in Which We Operate

Our business relies on residential new construction, commercial construction and industrial manufacturing activity, and to a lesser extent on residential repair/remodel, all of which are cyclical.

Demand for our services is cyclical and highly sensitive to general macroeconomic and local economic conditions over which we have no control.  Macroeconomic and local economic conditions, including consumer confidence levels, fluctuations in home prices, unemployment and underemployment levels, income and wage growth, student loan debt, household formation rates, mortgage tax deduction limits, the age and volume of the housing stock, the availability of home equity loans and mortgages and the interest rates for such loans, and other factors, affect consumers’ discretionary spending on both residential new construction projects and residential repair/remodel activity.  The commercial and industrial construction markets are affected by macroeconomic and local economic factors including, but not limited to, general economic conditions, cost of financing, credit availability, material costs, labor rates, vacancy and absorption rates, manufacturing capacity and demand, technological advancements, foreign and domestic competition, zoning and building regulations, and import and export activity.  Changes or uncertainty regarding these and similar factors could adversely affect our results of operations and our financial position.

We face significant competition, and increased competitive pressure may adversely affect our business, financial condition, results of operations and cash flows.

The market for the specialty distribution and installation of building products and materials is highly fragmented and competitive, and barriers to entry are relatively low.  Our Installation competitors include national contractors, regional contractors, and local contractors, and we face many or all of these competitors for each project on which we bid.  Our Specialty Distribution competitors include numerous specialty insulation distributors on a national, regional, and local level, as well as broad-line distributors that offer competitive products.  In some instances, our Specialty Distribution business sells products to companies that may compete directly with our installation service business.  We also compete with broad line building products distributors, big box retailers, insulation manufacturers, and mechanical insulation fabricators.  In addition to price, we believe that competition in our industry is based largely on existing customer relationships, customer service, and the quality and timeliness of installation services and distribution product deliveries in each local market.  In the event that increased demand leads to higher prices for the products we sell and install, we may have limited ability to pass on price increases in a timely manner, or at all, due to the fragmented and competitive nature of our industry.

19

Table of Contents

Our business is seasonal and is susceptible to adverse weather conditions and natural disasters.  We also may be adversely affected by any natural or man-made disruptions to our facilities.

We normally experience stronger sales in our Installation segment and in building insulation sales in our Specialty Distribution segment during the third and fourth calendar quarters, corresponding with the peak season for residential new construction and residential repair/remodel activity.  Sales during the winter weather months are seasonally slower due to the lower construction activity.  Historically, the installation of insulation lags housing starts by several months.  In addition, to the extent that hurricanes, severe storms, earthquakes, droughts, floods, fires, other natural disasters, or similar events occur in the geographic areas in which we operate, our business may be adversely affected.  Any widespread disruption to our facilities resulting from a natural disaster, an act of terrorism, or any other cause could materially impair our ability to provide installation and/or distribution services for our customers.  

We are subject to competitive pricing pressure from our customers.

Residential homebuilders historically have exerted significant pressure on their outside suppliers to keep prices low in the highly fragmented building products and materials supply and services industry. Similarly, contractors serving the construction industry and industrial customers exert pressure on our Specialty Distribution pricing. In addition, consolidation among homebuilders and changes in homebuilders’ and contractors’ purchasing policies or payment practices could result in additional pricing pressure.

Risks Relating to Our Operations Outside of the United States

We face risks relating to our operations outside of the United States.

A portion of our operations are conducted in Canada.  As a result, our operating results and financial condition could be materially adversely affected by economic, political, health, regulatory and other factors existing outside of the United States.  Our foreign operations are subject to inherent risks, which may materially adversely affect us, including: political and economic changes or instability; expropriation or the imposition of government controls; changes in government regulations; export requirements; trade restrictions; earnings repatriation and expatriation restrictions; exposure to different legal standards, including related to intellectual property and data privacy; health conditions and standards; currency controls; fluctuations in exchange rates; increases in the duties, tariffs, and taxes we pay (directly or indirectly); inflation or deflation; greater difficulty in collecting accounts receivable and longer payment cycles; changes in labor conditions, staffing, and managing our foreign operations; limitations on insurance coverage against geopolitical risks, natural disasters, and business operations; and communication among management and foreign operations.  In addition, these same factors may also place us at a competitive disadvantage compared to local competitors.

FCPA Risk

We may face risks associated with violations of the Foreign Corrupt Practices Act (“FCPA”) and similar anti-bribery laws. The FCPA and similar anti-bribery laws in other jurisdictions generally prohibit companies and their intermediaries from making improper payments to government officials for the purpose of obtaining or retaining business.  Our Code of Ethics mandates compliance with these anti-bribery laws.  We cannot assure you that our internal controls and procedures will always protect us from the detrimental actions of our employees or agents.  If we are found to be liable for FCPA violations (either due to our own acts or inadvertence or due to the acts or inadvertence of others), we could suffer from criminal or civil penalties or other sanctions, which could have a material adverse effect on our business.

We are exposed to fluctuations in foreign currency exchange rates that may adversely affect our business, financial condition, and operating results.

We transact business outside of the United States.  We present our Consolidated Financial Statements in U.S. dollars, but a portion of our revenues and expenditures are transacted in other currencies.  As a result, we are exposed to fluctuations in foreign currencies.  Additionally, we may have currency exposure arising from funds held in currencies other than U.S. dollars.  Volatility in the exchange rates between the foreign currencies and the U.S. dollar could materially harm our business, financial condition, or operating results.

20

Table of Contents

Risks Relating to Information Technology and Cybersecurity

We rely on information technology systems, and in the event of a disruption or security incident, we could experience problems operating our business and incur substantial costs to address resulting issues.

Our operations are dependent upon our information technology systems, including systems run by third-party vendors which we do not control, to operate our business including, but not limited to managing customer orders on a timely basis, coordinating our installation and specialty distribution activities across locations, and managing invoicing.  If we experience problems with our information technology systems, we could experience, among other things, delays in receiving customer orders, placing orders with suppliers, and scheduling production, installation services, deliveries, shipments, invoicing, or collections.

A substantial disruption in our information technology systems could have an adverse impact on revenue, harm our reputation, and cause us to incur legal liability and costs, which could be significant, to address and remediate such events and related security and operational issues.

In addition, we could be adversely affected if any of our significant customers or suppliers experience any similar events that disrupt their respective business operations or damage their reputations.

In the event of a cybersecurity incident, we could experience operational interruptions, incur substantial additional costs, become subject to legal or regulatory proceedings or suffer damage to our reputation.

In addition to the disruptions that may occur from interruptions in our information technology systems, cybersecurity threats and sophisticated and targeted cyberattacks pose a risk to our information technology systems.  We have established security policies, processes and defenses designed to help identify and protect against intentional and unintentional misappropriation or corruption of our information technology systems and disruption of our operations.  Despite these efforts, our information technology systems may be damaged, disrupted or shut down due to attacks by unauthorized persons, malicious software, computer viruses, undetected intrusion, hardware failures, or other events, and in these circumstances our disaster recovery plans may be ineffective or inadequate.  These breaches or intrusions could lead to business interruptions, exposure of proprietary or confidential information, data corruption, damage to our reputation, exposure to legal and regulatory proceedings, and other costs.  Such events could have an adverse impact on our financial condition, results of operations and cash flows.  We maintain monitoring practices and protections of our information technology to reduce these risks and test our systems on an ongoing basis for potential threats. In addition, we could be adversely affected if any of our significant customers or suppliers experience any similar events that disrupt their business operations or damage their reputations. There can be no assurance that our efforts will prevent the occurrence of a security breach of our databases or systems that could adversely affect our business.

Risks Relating to Liquidity and Our Ability to Finance Our Operations

If we are required to take significant non-cash charges, our financial resources could be reduced, and our financial flexibility may be negatively affected.

We have significant goodwill and other intangible assets related to business combinations on our balance sheet.  The valuation of these assets is largely dependent upon the expectations for future performance of our businesses.  Expectations about the growth of residential new construction, commercial/industrial construction, residential repair/remodel activity, and the utilization of industrial facilities, may impact whether we are required to recognize noncash, pretax impairment charges for goodwill and other indefinite lived intangible assets, or other long-lived assets.  If the value of our goodwill, other intangible assets, or long-lived assets is further impaired, our earnings and shareholders’ equity would be adversely affected and may impact our ability to raise capital in the future.

21

Table of Contents

We may have future capital needs and may not be able to obtain additional financing on acceptable terms.

Our future capital requirements will depend on many factors, including industry and market conditions, our ability to successfully complete future business combinations and the expansion of our existing operations.  We anticipate that we may need to raise additional funds in order to grow our business and implement our business strategy.  Economic and credit market conditions, the performance of the construction industry, and our financial performance, as well as other factors may constrain our financing abilities.  Our ability to secure additional financing and to satisfy our financial obligations will depend upon our future operating performance, the availability of credit, economic conditions, and financial, business, and other factors, many of which are beyond our control.  Any financing, if available, may be on terms that are not favorable to us and will be subject to changes in interest rates and the capital markets environment.  If we cannot obtain adequate capital, we may not be able to fully implement our business strategy and our business, operational results and financial condition could be adversely affected.

Our indebtedness and restrictions in our existing credit facility, senior notes or any other indebtedness we may incur in the future, could adversely affect our business, financial condition, results of operations, ability to make distributions to shareholders, and the value of our common stock.

Our indebtedness could have significant consequences on our future operations, including but not limited to:

making it more difficult for us to meet our payment and other obligations;  
reducing the availability of our cash flows to fund working capital, capital expenditures, acquisitions or strategic investments and other general corporate requirements, and limiting our ability to obtain additional financing for these purposes;  
subjecting us to increased interest expense related to our indebtedness with variable interest rates, including borrowings under our credit facility;
limiting our flexibility in planning for, or reacting to, and increasing our vulnerability to changes in our business, the industry in which we operate and the general economy; and
placing us at a competitive disadvantage compared to our competitors that have less debt or are less leveraged.

Any of the above-listed factors could have an adverse effect on our business, financial condition, results of operations, or ability to meet our payment obligations. If we are not able to generate sufficient cash flow to service our debt obligations, we may need to refinance or restructure our debt, sell certain assets, reduce or delay capital investments, or seek to raise additional capital, and some of these activities may be on terms that are unfavorable or highly dilutive.  Our ability to refinance our indebtedness will depend on the capital markets and our financial condition at such time.  If we are unable to implement one or more of these alternatives, we may not be able to meet our payment obligations.

Our existing term loan, revolving credit facility and the indentures governing our senior notes limit, and any future credit facility or other indebtedness we enter into may limit our ability to, among other things:

incur or guarantee additional debt;
make distributions or dividends on, or redeem or repurchase shares of our common stock;
make certain investments, acquisitions, or other restricted payments;
incur certain liens or permit them to exist;
acquire, merge, or consolidate with another company; and
transfer, sell, or otherwise dispose of substantially all of our assets.

Our revolving credit facility contains, and any future credit facility or other debt instrument we may enter into will also likely contain, covenants requiring us to maintain certain financial ratios and meet certain tests, such as an interest coverage ratio, a leverage ratio, and a minimum test.  Our ability to comply with those financial ratios and tests can be affected by events beyond our control, and we may not be able to comply with those ratios and tests when required to do so under the applicable debt instruments.  For additional information regarding our outstanding debt see Item 8. Financial Statements and Supplementary Data – Note 6. Long-Term Debt.

22

Table of Contents

Adverse credit ratings could increase our costs of borrowing money and limit our access to capital markets and commercial credit.

Moody’s Investor Service and Standard & Poor’s routinely evaluate our credit ratings related to our senior notes.  If these rating agencies downgrade any of our current credit ratings, our borrowing costs could increase and our access to the capital and commercial credit markets could be adversely affected.

In connection with the Separation, Masco indemnified us for certain liabilities, and we indemnified Masco for certain liabilities.  If we are required to act under these indemnities to Masco, we may need to divert cash to meet those obligations, which could adversely affect our financial results.  Moreover, the Masco indemnity may not be sufficient to compensate us for the full amount of liabilities for which it may be liable, and Masco may not be able to satisfy its indemnification obligations to us in the future.

Indemnities that we may be required to provide Masco are not subject to any cap, may be significant, and could negatively affect our business, particularly indemnities relating to our actions that could affect the tax-free nature of the Separation.  Third parties could also seek to hold us responsible for any of the liabilities that Masco has agreed to retain, and under certain circumstances, we may be subject to continuing contingent liabilities of Masco following the Separation, such as certain shareholder litigation claims.  Further, Masco may not be able to fully satisfy its indemnification obligations, or such indemnity obligations may not be sufficient to cover our liabilities.  Moreover, even if we ultimately succeed in recovering from Masco any amounts for which we are held liable, we may be temporarily required to bear these losses ourselves.  Each of these risks could negatively affect our business, results of operations, liquidity, and financial condition.

Compliance with and changes in tax laws could adversely affect our performance.

We are subject to extensive tax liabilities imposed by multiple jurisdictions including income taxes; indirect taxes which include excise and duty, sales and use, and gross receipts taxes; payroll taxes; franchise taxes; withholding taxes; and ad valorem taxes.  New tax laws and regulations, and changes in existing tax laws and regulations, are continuously being enacted or proposed which could result in increased expenditures for tax liabilities in the future.  Many of these liabilities are subject to periodic audits by the respective taxing authority.  Subsequent changes to our tax liabilities as a result of these audits may subject us to interest and penalties.

Risks Relating to Our Common Stock

The price of our common stock may fluctuate substantially, and the value of your investment may decline.

The market price of our common stock could fluctuate significantly due to a number of factors, many of which are beyond our control, including:

fluctuations in our quarterly or annual earnings results, or those of other companies in our industry;
failures of our operating results to meet our published guidance, the estimates of securities analysts or the expectations of our shareholders, or changes by securities analysts in their estimates of our future earnings;
announcements by us or our customers, suppliers, or competitors;
changes in laws or regulations which adversely affect our industry or us;
changes in accounting standards, policies, guidance, interpretations, or principles;
general economic, industry, and stock market conditions;
future sales of our common stock by our shareholders;
future issuances of our common stock by us; and
other factors described in these “Risk Factors” and elsewhere in this Annual Report.

23

Table of Contents

Provisions in our certificate of incorporation and bylaws, and certain provisions of Delaware law, could delay or prevent a change in control.

The existence of some provisions of our certificate of incorporation and bylaws and Delaware law could discourage, delay, or prevent a change in control that a shareholder may consider favorable.  These include provisions:

authorizing a large number of shares of stock that are not yet issued, which could have the effect of preventing or delaying a change in control if our board of directors issued shares to persons that did not support such change in control, or which could be used to dilute the stock ownership of persons seeking to obtain control; and
prohibiting shareholders from calling special meetings of shareholders or taking action by written consent.

In addition, we are subject to Section 203 of the Delaware General Corporation Law, which may have an anti-takeover effect with respect to transactions not approved in advance by our board of directors, including discouraging takeover attempts that could have resulted in a premium over the market price for shares of our common stock.

These provisions apply even if a takeover offer is considered beneficial by some shareholders and could delay or prevent an acquisition that our board of directors determines is not in our and our shareholders’ best interests.

Our bylaws designate the Court of Chancery of the State of Delaware as the sole and exclusive forum for certain types of actions and proceedings that may be initiated by our shareholders, which could limit our shareholders’ ability to obtain a preferred judicial forum for disputes with us or our directors, officers, or other employees.

Our bylaws provide that, unless we consent in writing to the selection of an alternative forum, the sole and exclusive forum for (i) any derivative action or proceeding brought on our behalf, (ii) any action asserting a claim of breach of a fiduciary duty owed by any director, officer, or other employee to us or our shareholders, (iii) any action asserting a claim arising pursuant to any provision of Delaware General Corporation Law, our certificate of incorporation (including any certificate of designations for any class or series of our preferred stock), or our bylaws, in each case, as amended from time to time, or (iv) any action asserting a claim governed by the internal affairs doctrine, shall be the Court of Chancery of the State of Delaware (provided, however, that in the event that the Court of Chancery of the State of Delaware lacks subject matter jurisdiction over such proceeding, the sole and exclusive forum for such action or proceeding shall be another state or federal court located within the State of Delaware), in all cases subject to the court having personal jurisdiction over the indispensable parties named as defendants.  Any person or entity purchasing or otherwise acquiring any interest in shares of our capital stock is deemed to have received notice of, and consented to, the foregoing provision.  This forum selection provision may limit a shareholder’s ability to bring a claim in a judicial forum that it finds favorable or cost effective for disputes with us or our directors, officers, or other employees, which may discourage such lawsuits against us and our directors, officers, and employees.

Item 1B.  UNRESOLVED STAFF COMMENTS

None.

Item 1C.  CYBERSECURITY RISK MANAGEMENT, STRATEGY AND GOVERNANCE

Cybersecurity Risk Management Program

We recognize the importance of maintaining the integrity of our information technology systems and safeguarding the confidential business and personal information we receive and store about our employees, customers and suppliers.  We have a cybersecurity risk management program in place to identify, assess, and manage risks from cybersecurity threats.  Our cybersecurity risk management program is designed to employ industry best practices across our operations and business functions, including monitoring and analysis of the threat environment, vulnerability assessments, and third-party cybersecurity risks; detecting and responding to cyber attacks, cybersecurity incidents, and data breaches; cybersecurity crisis preparedness, incident response plans, and business continuity and disaster recovery capabilities; and investments in cybersecurity infrastructure and program needs.  Among the key features of our program are:

24

Table of Contents

Periodic independent, third-party reviews of our program and its maturity based on the National Institute of Standards and Technology (NIST) cybersecurity framework;
Strategic engagements of consulting firms and legal advisors to advise the Board and our executive officers regarding the structure and oversight of our cybersecurity risk management program, cyber strategy framework evolution, risk-based assessments, incident response services, and cyber technology;
Consulting with external advisors and specialists on specific projects regarding opportunities and enhancements to strengthen our cyber practices and policies on an as needed basis;
Periodic review of SOC1 and SOC2 audit reports submitted by our strategic third-party technology suppliers, as prepared by their external auditors;
Ongoing cybersecurity training for employees; and
Periodic testing of incident response procedures.

In addition to the third parties described above, we regularly engage consultants, advisors, service providers and other third parties to help test, develop and manage our cybersecurity risk management program.

Our cybersecurity risk management program includes technology and processes designed to maintain active security of our information technology systems.  We have not experienced a material cyber breach in the last three years.  We do not believe that any risks from cybersecurity threats of which we are currently aware, including as a result of any previous cybersecurity incidents, have materially affected or are reasonably likely to materially affect us, including our business strategy, results of operations or financial condition.  However, despite our security measures, there is no assurance that we, or the third parties with which we interact, will not experience a cybersecurity incident in the future that will materially affect us.  For additional information regarding the risks to the Company associated with cybersecurity incidents, see “In the event of a cybersecurity incident, we could experience operational interruptions, incur substantial additional costs, become subject to legal or regulatory proceedings or suffer damage to our reputation,” included in Part I, Item 1A (Risk Factors) of this Annual Report.

To help identify and manage cybersecurity risks associated with our use of third-party service providers, we have implemented processes to assess third-party systems which could be compromised in a manner that adversely impacts the Company and our technology systems.  In this regard, we conduct due diligence of significant third-party service providers who will have access to our information technology systems and incorporate cybersecurity protections in our engagement contracts with such providers.  In addition, we require such third-party service providers to promptly notify us of any actual or suspected breach impacting our data or operations.  Further, our external auditor reviews our processes designed to control access to our information technology systems as part of its assessment of our internal controls.

Incident Response Procedures

We have in place a cyber incident response plan outlining procedures to follow in the event of a cybersecurity incident.  Under the plan, we established a cross-functional critical response team (CRT) with expertise in various subject matter areas responsible for initiating and leading our incident response procedures.  The CRT is under the direction of our Chief Information Officer and is comprised of our Director of Information Technology, Chief Accounting Officer, Assistant General Counsel and Chief Compliance Officer, Senior Manager of Risk and Insurance, and certain other members of management.  The plan provides that our CRT will conduct an impact assessment in the event of a cybersecurity incident meeting pre-established criteria, or which may otherwise impact the operations or finances of the Company.  If any such cybersecurity incident is determined by the CRT to have the potential to materially impact the Company, such event would be elevated for further review and assessment by a senior leadership team consisting of our Chief Executive Officer, Chief Financial Officer, General Counsel and other members of our executive leadership team.  Under certain circumstances, such review and assessment would include reporting to and oversight of the Board.  

25

Table of Contents

Governance

Our full Board is responsible for oversight of risks from cybersecurity threats, including our cybersecurity risk management program.  In carrying out its oversight responsibilities, the Board receives regular cybersecurity program updates and quarterly scorecard assessments from our Chief Information Officer, which cover topics related to information security, privacy and cyber risks, and our risk management processes, including the status of any recent cybersecurity events meeting specified criteria, the emerging threat landscape, and the status of capital investments in our information security infrastructure.  

At a management level, our cybersecurity risk management program is led by our Chief Information Officer, who reports to our Chief Executive Officer.  Under our Chief Information Officer’s leadership, the cybersecurity team implements and provides governance and functional oversight for cybersecurity controls and services.  The team’s credentials include Certified Chief Information Security Officer, Certified Information Security Manager and Certified Information Systems Security Professional.  

To help identify, assess, and manage risks from cybersecurity threats, we have integrated cybersecurity risk management into our broader, Company-wide enterprise risk management (ERM) evaluation and strategy process, which is led by our executive officers, overseen by the Audit Committee of the Board, and reviewed annually by the full Board.  Our ERM process takes a top-down, enterprise view of material risks impacting our Company, including credit, liquidity, strategy, cybersecurity, and operational risks, and is an ongoing process consisting of risk identification, risk rating, analysis and action plans, and reporting and monitoring.  Employees responsible for assessing identified risks deliver an update quarterly to our senior leadership team, which consists of our Chief Executive Officer, Chief Financial Officer, Chief Information Officer, General Counsel, Chief Human Resources Officer, Chief Growth Officer, and Vice President of Supply Chain.  Status updates with respect to these risk areas are delivered quarterly by management to the Audit Committee of the Board, and full risk assessment results are presented by management annually to the full Board.

Item 2.  PROPERTIES

We operate approximately 250 Installation branch locations and approximately 190 Specialty Distribution centers in the United States and Canada, most of which are leased.  Our 65,700 square foot Branch Support Center is leased and located at 475 North Williamson Boulevard in Daytona Beach, FL 32114.  This lease expires in June 2029, assuming no exercise of any options set forth in the lease.  We believe that our facilities have sufficient capacity and are adequate for our installation and specialty distribution requirements.

Item 3.  LEGAL PROCEEDINGS

For information regarding legal proceedings, see Item 8. Financial Statements and Supplementary Data – Note 11. Other Commitments and Contingencies, which we incorporate herein by reference.

Item 4.  MINE SAFETY DISCLOSURES

Not applicable.

26

Table of Contents

PART II

Item 5.  MARKET FOR REGISTRANT’S COMMON EQUITY, RELATED SHAREHOLDER MATTERS, AND ISSUER PURCHASES OF EQUITY SECURITIES

Market Information and Holders of our Common Stock.  Our common stock is traded on the NYSE under the symbol “BLD”.  As of February 18, 2025, there were 1,309 holders of our issued and outstanding common stock.

Dividends.  No dividends were paid during the years ended December 31, 2024 and 2023. Our Credit Agreement, in certain circumstances, limits the amount of dividends we may distribute.  We do not anticipate declaring cash dividends to holders of our common stock in the foreseeable future.

Issuer Purchases of Equity Securities. We have $188.1 million remaining under our 2024 Share Repurchase Program. The following table provides information regarding the repurchases of our common stock for the three months ended December 31, 2024, in thousands, except share and per share data:

Period

Total Number of Shares Purchased

Average Price Paid per Common Share

Number of Shares Purchased as Part of Publicly Announced Plans or Programs

Approximate Dollar Value of Shares that May Yet Be Purchased Under the Plans or Programs

October 1, 2024 - October 31, 2024

-

-

-

$

235,220

November 1, 2024 - November 30, 2024

56,642

$

364.95

56,642

$

214,548

December 1, 2024 - December 31, 2024

78,230

338.67

78,230

$

188,054

Total

134,872

$

349.71

134,872

Excluded from this disclosure are shares repurchased to settle statutory employee tax withholdings related to the vesting of stock awards.

Performance Graph and Table. The following graph and table compare the cumulative total return of our common stock for the five-year period beginning January 1, 2020, through December 31, 2024, with the total cumulative return of the Russell 2000 Index, the Standard & Poor’s 500 Index, and the Standard & Poor’s 1500 Building Products Index. The graph and table assume an initial investment of $100 in our common stock and each of the three indices at the opening of business on January 1, 2020, and reinvestment of dividends.

27

Table of Contents

Graphic

12/31/2019

12/31/2020

12/31/2021

12/31/2022

12/31/2023

12/31/2024

TopBuild Corp.

$

100

$

179

$

268

$

152

$

363

$

302

Standard & Poor's 500 Index

$

100

$

117

$

148

$

119

$

148

$

183

Russell 2000 Index

$

100

$

119

$

135

$

106

$

122

$

134

Standard & Poor's 1500 Building Products Index

$

100

$

128

$

188

$

144

$

208

$

250

Item 6.  [Reserved]

28

Table of Contents

Item 7.  MANAGEMENT’S DISCUSSION AND ANALYSIS OF FINANCIAL CONDITION AND RESULTS OF OPERATIONS

The financial and business analysis below provides information which we believe is relevant to an assessment and understanding of our financial position, results of operations, and cash flows.  This financial and business analysis should be read in conjunction with the financial statements and related notes.

In this section, we generally discuss the results of our operations for the year ended December 31, 2024, compared to the year ended December 31, 2023. For a discussion of the year ended December 31, 2023, to the year ended December 31, 2022, please refer to Part II, Item 7, “Management’s Discussion and Analysis of Financial Condition and Results of Operations” in our Annual Report on Form 10-K for the year ended December 31, 2023, filed with the SEC on February 28, 2024, which discussion is hereby incorporated herein by reference.

Executive Summary

We are a leading installer and specialty distributor of insulation and related building material products to the construction industry in the United States and Canada.  Demand for our products and services is driven primarily by residential and commercial/industrial construction and by industrial manufacturing activity.  A number of local and national factors influence activity in each of our lines of business, including demographic trends, interest rates, employment levels, business investment, supply and demand for housing, availability of credit, foreclosure rates, consumer confidence, and general economic conditions.  

The core of our business is inherently environmentally friendly.   The insulation we install and distribute drives thermal efficiency, lowers energy usage, and reduces carbon emissions.  We are a leader in delivering these benefits for new and existing homes and commercial/industrial facilities across the United States and Canada.  

Strategy

We are committed to creating long-term value for all stakeholders – employees, customers, suppliers, and investors.  Our team is focused on driving operational efficiencies and sharing best practices throughout our organization.  Our core values include:

Safety – We put the safety of our people first.
Integrity – We deliver results with integrity, respect, and accountability.
Focus – We are customer-focused, grounded in strong relationships.
Innovation – We are continuously improving and encourage idea sharing.
Unity – We are united as one team, valuing diversity.
Community – We make a difference in the communities we serve.
Empowerment – We are empowered to be our best, individually and as a team.

Our strategy is focused on growth and productivity including:

Attracting and retaining top talent
Leveraging technology to streamline processes;
Expanding our business in the residential and commercial/industrial end-markets;
Acquiring strategically aligned businesses;
Driving operational efficiencies throughout the business.

Our operating results depend on residential new construction activity, commercial construction activity and industrial manufacturing activity, all of which are subject to business and economic cycles.  These cycles have less of an impact on our Specialty Distribution segment due to the repair and replacement component of our mechanical insulation distribution business.  We are also dependent on third-party suppliers and manufacturers providing us with an adequate supply of high-quality products.  

29

Table of Contents

Material Trends in Our Business

Residential New Construction

We did not see the acceleration in demand for single-family homes in the back half of 2024 that we anticipated earlier in the year.  Demand for single-family homes continues to be uneven across the country.

Multi-family starts were slow throughout 2024 and that has started to negatively impact sales.   We expect our multi-family sales will continue to be slow as we move into 2025.  Multi-family housing units typically require approximately 40% of the insulation that a single-family unit requires.

As a result of years of underbuilding in the United States an overall shortage of housing exists across the country.  In addition, we believe long-term demand for homes will continue to be supported by strengthening energy efficiency requirements and increased household formations.  As a result, we continue to be optimistic about the long-term fundamentals of our business.

Commercial and Industrial Construction

Our commercial backlog is strong, and our bidding activity is active, both of which continue to support our positive view of commercial/industrial sales at our Installation and Specialty Distribution segments. Some projects have been delayed in 2024, but we have not seen an uptick in cancellations. In addition, recurring maintenance and repair work on industrial sites serves as a continued driver for our Specialty Distribution business.

Seasonality

Sales across our end markets are typically slower during the winter months due to lower construction activity.

Results of Operations

We report our financial results in conformity with GAAP.  

The following table sets forth our net sales, gross profit, operating profit, and margins, as reported in our Consolidated Statements of Operations, in thousands:

Year Ended December 31, 


2024


2023


Net sales

$

5,329,803

$

5,194,694

Cost of sales

3,704,885

3,590,874

Cost of sales ratio

69.5

%

69.1

%

Gross profit

1,624,918

1,603,820

Gross profit margin

30.5

%

30.9

%

Selling, general, and administrative expense

738,575

724,995

Selling, general, and administrative expense to sales ratio

13.9

%

14.0

%

Operating profit

886,343

878,825

Operating profit margin

16.6

%

16.9

%

Other expense, net

(45,555)

(53,342)

Income tax expense

(218,186)

(211,229)

Net income

$

622,602

$

614,254

Net margin

11.7

%

11.8

%

30

Table of Contents

Comparison of the Years Ended December 31, 2024 and December 31, 2023

Sales and Operations

Net sales for 2024 increased 2.6 percent, or $135.1 million, to $5.3 billion.  The increase was driven by a 2.5 percent increase in sales from acquisitions and a 1.1 percent impact from higher selling prices, partially offset by a 0.7 percent decline in sales volume and a decline of 0.3 percent driven by the disposition of a non-core business.

Our gross profit margins were 30.5 percent and 30.9 percent for 2024 and 2023, respectively. The decline in gross profit margin is primarily due to higher material costs and lower benefit of sales mix, partially offset by improved productivity and higher selling prices.

Selling, general, and administrative expenses as a percentage of sales were 13.9 percent and 14.0 percent for 2024 and 2023, respectively.

Operating margins were 16.6 percent and 16.9 percent for 2024 and 2023, respectively. The decline in operating margin was due to higher material costs and lower benefit sales mix, partially offset by higher selling prices and productivity initiatives.  

Other Expense, Net

Other expense, net, decreased $7.8 million to $45.6 million in 2024 from $53.3 million in 2023. The decrease is primarily related to $5.1 million higher interest income due to higher average levels of invested cash balances throughout the year and $1.5 million lower interest expense due to declining interest rates in the fourth quarter of 2024.

Income Tax Expense

Our effective tax rate increased from 25.6 percent in 2023 to 26.0 percent in 2024.  The higher 2024 rate was primarily related to share-based compensation.

2024 and 2023 Business Segment Results

The following table sets forth our net sales and operating profit information by business segment, in thousands:

Year Ended December 31, 


2024


2023


Percent Change

Net sales by business segment:

Installation

$

3,294,630

$

3,188,232

3.3

%

Specialty Distribution

2,340,837

2,268,339

3.2

%

Intercompany eliminations

(305,664)

(261,877)

Net sales

$

5,329,803

$

5,194,694

2.6

%

Operating profit by business segment (a):

Installation

$

649,162

$

644,392

0.7

%

Specialty Distribution

352,431

330,938

6.5

%

Intercompany eliminations

(49,834)

(44,438)

Operating profit before general corporate expense

951,759

930,892

2.2

%

General corporate expense, net (b)

(65,416)

(52,067)

Operating profit

$

886,343

$

878,825

0.9

%

Operating profit margins:

Installation

19.7

%

20.2

%

Specialty Distribution

15.1

%

14.6

%

Operating profit margin before general corporate expense

17.9

%

17.9

%

Operating profit margin

16.6

%

16.9

%

(a)Segment operating profit includes an allocation of general corporate expenses attributable to the operating segments which is based on direct benefit or usage (such as salaries of corporate employees who directly support the segment).  
(b)General corporate expense, net includes expenses not specifically attributable to our segments for functions such as corporate human resources, finance and legal, including salaries, benefits, and other related costs. In our second quarter of 2024, we incurred an acquisition termination fee of $23.0 million.  See Item 8. Financial Statements and Supplementary Data – Note 8. Segment Information and Note 15. Business Combinations.  

31

Table of Contents

2024 and 2023 Business Segment Results Discussion

Changes in operating profit margins in the following business segment results discussion exclude general corporate expense, net in 2024 and 2023, as applicable.

Installation

Sales

Sales increased $106.4 million, or 3.3 percent, in 2024 compared to 2023.  Sales increased 3.1 percent from our acquisitions and 1.3 percent from higher selling prices, partially offset by 0.6 percent decrease from lower sales volume and by a decline of 0.5 percent driven by the disposition of a non-core business.  

Operating Results

Operating margins in the Installation segment were 19.7 percent and 20.2 percent for 2024 and 2023, respectively.  The decrease in operating margin was driven higher material costs and change in sales mix, partially offset by productivity initiatives and higher selling prices.

Specialty Distribution

Sales

Sales increased $72.5 million, or 3.2 percent, in 2024 compared to 2023.  Sales increased 1.3 percent from our acquisitions, 1.0 percent from higher sales volume and 0.9 from higher selling prices.

Operating Results

Operating margins in the Specialty Distribution segment were 15.1 percent and 14.6 percent for 2024 and 2023, respectively.  The increase in operating margin was driven by productivity initiatives and higher selling prices, partially offset by higher material costs.


Commitments and Contingencies

We are subject to certain claims, charges, litigation, and other proceedings in the ordinary course of our business. We believe we have adequate defenses in these matters, and we do not believe that the ultimate outcome of these matters will have a material adverse effect on us.  For additional information see Item 8. Financial Statements and Supplementary Data – Note 11. Other Commitments and Contingencies.

Liquidity and Capital Resources

We have access to liquidity through our cash from operations and available borrowing capacity under our Credit Agreement, which provides for borrowing and/or standby letter of credit issuances of up to $500 million under the revolving facility. For additional information regarding our outstanding debt and borrowing capacity see Item 8. Financial Statements and Supplementary Data – Note 6. Long-Term Debt.  

32

Table of Contents

The following table summarizes our total liquidity, in thousands:

As of December 31, 


2024


2023

Cash and cash equivalents (a)

$

400,318

$

848,565

Revolving facility

500,000

500,000

Less: standby letters of credit

(63,770)

(63,770)

Availability under Revolving facility

436,230

436,230

Total liquidity

$

836,548

$

1,284,795

(a)Our cash and cash equivalents consist of AAA-rated money market funds as well as cash held in our demand deposit accounts.

We believe that our cash flows from operations, combined with our current cash levels and available borrowing capacity, will be adequate to support our ongoing operations and known contractual obligations including funding our debt service requirements, capital expenditures, lease obligations and working capital needs for at least the next twelve months. We also have adequate liquidity to maintain off-balance sheet arrangements for short-term leases, letters of credit, and performance and license bonds. See Item 8. Financial Statements and Supplementary Data of this Annual Report for related disclosures.

We occasionally use performance bonds to ensure completion of our work on certain larger customer contracts that can span multiple accounting periods.  Performance bonds generally do not have stated expiration dates; rather, we are released from the bonds as the contractual performance is completed.  We also have bonds outstanding for license and insurance.

The following table summarizes our outstanding performance, licensing, insurance, and other bonds, in thousands:

As of December 31, 

2024

2023

Outstanding bonds:

Performance bonds

$

146,479

$

145,982

Licensing, insurance, and other bonds

28,462

27,415

Total bonds

$

174,941

$

173,397

Cash Flows

The following table presents a summary of our cash flows provided by (used in) operating, investing and financing activities for the periods indicated, in thousands:

Year Ended December 31, 


2024


2023

Changes in cash and cash equivalents:

Net cash provided by operating activities

$

776,026

$

849,409

Net cash used in investing activities


(203,523)


(198,170)

Net cash used in financing activities

(1,016,272)

(43,836)

Impact of exchange rate changes on cash

(4,478)

1,093

Net (decrease) increase in cash and cash equivalents

$

(448,247)

$

608,496

Net cash flows provided by operating activities decreased $73.4 million for the year ended December 31, 2024, as compared to December 31, 2023.  Net income increased $8.3 million, or 1.4 percent, compared with the prior year period, driven by the impact of higher selling prices and our acquisitions, as well as productivity initiatives.  We also incurred increases in working capital accounts, specifically inventory and accounts payable, leading to more cash used in operations.

33

Table of Contents

Net cash used in investing activities was $203.5 million for the year ended December 31, 2024, primarily comprised of $136.8 million for acquisitions and $69.3 million for purchases of property and equipment (primarily vehicles, equipment and computer hardware and software). Those uses were partially offset by $2.6 million of proceeds received from the sale of assets.  Net cash used in investing activities was $198.2 million for the year ended December 31, 2023, primarily comprised of $149.2 million for acquisitions and $64.0 million for purchases of property and equipment (primarily vehicles, equipment and computer hardware and software). Those uses were partially offset by $15.0 million of proceeds received from the sale of assets.

Net cash used in financing activities was $1.0 billion for the year ended December 31, 2024. During the year ended December 31, 2024, we used $966.4 million for the repurchase of common stock, $47.0 million for debt repayments, and $2.9 million net activity related to exercise of share-based incentive awards and stock options. Net cash used in financing activities was $43.8 million for the year ended December 31, 2023. During the year ended December 31, 2023, we used $40.1 million for debt repayments and $3.4 million net activity related to exercise of share-based incentive awards and stock options.

Critical Accounting Policies and Estimates

We prepare our Consolidated Financial Statements in conformity with GAAP.  The preparation of these financial statements requires us to make estimates and assumptions that affect the reported amounts and disclosure of assets and liabilities, and any related contingencies, at the date of the financial statements, as well as the reported amounts of sales and expenses during the reporting period.  Actual results could differ from those estimates. 

Our significant accounting policies are more fully described in Item 8. Financial Statements and Supplementary Data – Note 1. Summary of Significant Accounting Policies.  However, certain of our accounting policies considered critical are those we believe are both most important to the portrayal of our financial condition and operating results and require our most difficult, subjective, or complex judgments, often as a result of the need to make estimates about the effect of matters that are inherently uncertain.  Judgments and uncertainties affecting the application of those policies may result in materially different amounts being reported under different conditions or using different assumptions.  We consider the following policies to be most critical in understanding the judgments that are involved in preparing our Consolidated Financial Statements. 

Revenue Recognition and Receivables

Revenue is disaggregated between our Installation and Specialty Distribution segments.  A reconciliation of disaggregated revenue by segment is included in Item 8. Financial Statements and Supplementary Data – Note 8. Segment Information. We recognize revenue for our Installation segment over time as the related performance obligation is satisfied with respect to each particular order within a given customer’s contract. Progress toward complete satisfaction of the performance obligation is measured using a cost-to-cost measure of progress method. The cost input is based on the amount of material installed at that customer’s location and the associated labor costs, as compared to the total expected cost for the particular order. The total expected cost is an estimate in the revenue recognition process, requires judgment, and is subject to variability throughout the duration of the contract as a result of contract modifications and other circumstances impacting job completion. Generally, this results in revenue being recognized as the customer is able to receive and utilize the benefits provided by our services. Each contract contains one or more individual orders, which are based on services delivered. When material and installation services are bundled in a contract, we combine these items into one performance obligation as the overall promise is to transfer the combined item.

Revenue from our Specialty Distribution segment is recognized when title to products and risk of loss transfers to our customers. This represents the point in time when the customer is able to direct the use of and obtain substantially all the benefits from the product. The determination of when control is deemed transferred depends on the delivery terms that are agreed upon in the contract.

34

Table of Contents

The transaction price is the amount of consideration the Company expects to receive based on the arrangement with the customer. The duration of our contracts with customers is relatively short, generally less than a 90-day period, therefore there is not a significant financing component when considering the determination of the transaction price which gets allocated to the individual performance obligations, generally based on standalone selling prices. Additionally, we consider shipping costs charged to a customer as a fulfillment cost rather than a promised service and expense as incurred. Sales taxes, when incurred, are recorded as a liability and excluded from revenue on a net basis.

We record a contract asset when we have satisfied our performance obligation prior to billing and a contract liability when a customer payment is received prior to the satisfaction of our performance obligation. The difference between the beginning and ending balances of our contract assets and liabilities primarily results from the timing of our performance and the customer’s payment. See Note 3 – Revenue Recognition for more information.

We maintain allowances for estimated losses resulting from the inability of customers to make required payments.  In addition, we monitor our customer receivable balances and the credit worthiness of our customers on an on-going basis.  During downturns in our markets, declines in the financial condition and creditworthiness of customers impact the credit risk of the receivables involved and we have incurred additional bad debt expense related to customer defaults.

Business Combinations

The purchase price for business combinations is allocated to the estimated fair values of acquired tangible and intangible assets, including goodwill, and assumed liabilities, where applicable.  Additionally, we recognize customer relationships, trademarks and trade names, and non-compete agreements as identifiable intangible assets, which are recorded at fair value as of the transaction date. The fair value of the customer relationships intangible assets is determined by management using the multi-period excess earnings method under the income approach. Assumptions used in determining the fair value of the customer relationships intangible asset include forecasted revenue growth rate, customer attrition rate, and discount rate. The fair value of other intangible assets is determined primarily using current industry information.  Goodwill is recorded when consideration transferred exceeds the fair value of identifiable assets and liabilities.  Measurement-period adjustments to assets acquired and liabilities assumed with a corresponding offset to goodwill are recorded in the period they occur, which may include up to one year from the acquisition date.  Contingent consideration is recorded at fair value at the acquisition date.

Goodwill and Other Intangible Assets

We have two reporting units, which are also our operating and reporting segments: Installation and Specialty Distribution, and both contain goodwill.  Our operating segments engage in business activities for which discrete financial information including long range forecasts is available, and we complete the impairment testing of goodwill at this level, as defined by accounting guidance. Assets acquired and liabilities assumed are assigned to the applicable reporting unit based on whether the acquired assets and liabilities relate to the operations of such unit and determination of its fair value.  Goodwill assigned to the reporting unit is the excess of the fair value of the acquired business over the fair value of the individual assets acquired and liabilities assumed for the reporting unit.

We perform our annual impairment testing of goodwill in the fourth quarter of each year, or as events occur or circumstances change that would more likely than not reduce the fair value of a reporting unit below its carrying amount. When assessing goodwill for impairment, we have the option to first assess qualitative factors to determine whether the existence of events or circumstances leads to a determination that it is more likely than not that the fair value of a reporting unit is less than its carrying amount. If, after assessing the totality of events or circumstances, we determine it is more likely than not that the fair value of a reporting unit is less than its carrying amount, then we recognize an impairment charge for the amount by which the carrying amount exceeds the reporting unit’s fair value. If we conclude otherwise, then no further action is taken. We also have the option to bypass the qualitative assessment and only perform a quantitative assessment. For the years ended December 31, 2024 and 2023, we performed qualitative assessments.

35

Table of Contents

Fair value for our reporting units is determined using a discounted cash flow method and a market multiple approach (with a 50% weighting of each), both which include significant unobservable inputs (Level 3 inputs).  We believe these methodologies are comparable to what would be used by other market participants.  Using the discounted cash flow method requires us to make significant estimates and assumptions, including long term projections of cash flows, market conditions, and appropriate discount rates.  Our judgments are based on historical experience, current market trends, consultations with external valuation specialists and other information.  The market approach includes a comparison of the multiple of a reporting unit's carrying value to its earnings before interest, taxes, depreciation and amortization with the multiples of similar businesses or guideline companies whose securities are actively traded in the public markets.  While we believe that the estimates and assumptions underlying the valuation methodologies are reasonable, changes to estimates and assumptions could result in different outcomes.  In estimating future cash flows, we rely on internally generated long-range forecasts for sales and operating profits, and generally a one to three percent long term assumed annual growth rate of cash flows for periods after the long-range forecast.  We generally develop these forecasts based upon, among other things, recent sales data for existing products, and estimated U.S. housing starts.

When necessary, an impairment loss is recognized to the extent that a reporting unit’s recorded goodwill exceeds its fair value. In the fourth quarters of 2024 and 2023, we performed an assessment on our goodwill and determined that the estimated fair value of each reporting unit substantially exceeded its carrying value, and therefore the goodwill was not impaired.

We did not recognize any impairment charges for goodwill for the years ended December 31, 2024, 2023, and 2022. As of December 31, 2024, net goodwill reflected $762.0 million of accumulated impairment losses, relating primarily to impairment charges taken in 2008-2010 following the substantial decrease in U.S. housing starts after the financial crisis of 2007-2008.

Intangible assets with finite useful lives are amortized using the straight-line method over their estimated useful lives. We evaluate the remaining useful lives of amortizable identifiable intangible assets at each reporting period to determine whether events and circumstances warrant a revision to the remaining periods of amortization.

Income Taxes

If, based upon all available evidence, both positive and negative, it is more likely than not (more than 50 percent likely) deferred tax assets will not be realized, a valuation allowance is recorded.  Significant weight is given to positive and negative evidence that is objectively verifiable.  A company’s three-year cumulative loss position is significant negative evidence in considering whether deferred tax assets are realizable and the accounting guidance restricts the amount of reliance we can place on projected taxable income to support the recovery of deferred tax assets.

While we believe we have adequately assessed for our uncertain tax positions, amounts asserted by taxing authorities could vary from our assessment of uncertain tax positions.  Accordingly, provisions for tax-related matters, including interest and penalties, could be recorded in income tax expense in the period revised assessments are made. These unrecognized tax positions including associated interest and penalties are not material to our consolidated financial statements for the periods presented.

Additionally, we generally do not provide for taxes related to undistributed earnings as such earnings would not be taxable when remitted or would be considered to be indefinitely reinvested.

Recently Issued Accounting Pronouncements

Recently issued accounting pronouncements and their expected or actual effect on our reported results of operations are addressed in Item 8. Financial Statements and Supplementary Data – Note 1. Summary of Significant Accounting Policies.

36

Table of Contents

Item 7A.  QUANTITATIVE AND QUALITATIVE DISCLOSURES ABOUT MARKET RISK

Interest Rate Risk

We have a Term Loan outstanding with a principal balance of $487.5 million and a revolving facility with an aggregate borrowing capacity of $500.0 million. We also have outstanding 3.625% Senior Notes with an aggregate principal balance of $400.0 million and 4.125% Senior Notes with an aggregate principal balance of $500.0 million.  The 3.625% Senior Notes and 4.125% Senior Notes bear a fixed rate of interest and therefore are excluded from the calculation below as they are not subject to fluctuations in interest rates.

Interest payable on both the aggregate Term Loan and revolving facility is based on a variable interest rate.  As a result, we are exposed to market risks related to fluctuations in interest rates on this outstanding indebtedness.  As of December 31, 2024, the applicable interest rate as of such date was 5.46%.  Based on our outstanding borrowings as of December 31, 2024, a 100-basis point increase in the interest rate would result in a $4.7 million increase in our annualized interest expense.  There was no outstanding balance under the revolving facility as of December 31, 2024.

37

Table of Contents

Item 8.  FINANCIAL STATEMENTS AND SUPPLEMENTARY DATA

Report of Independent Registered Public Accounting Firm

To the Board of Directors and Shareholders of TopBuild Corp.

Opinions on the Financial Statements and Internal Control over Financial Reporting

We have audited the accompanying consolidated balance sheets of TopBuild Corp. and its subsidiaries (the “Company”) as of December 31, 2024 and 2023, and the related consolidated statements of operations, of comprehensive income, of changes in shareholders’ equity and of cash flows for each of the three years in the period ended December 31, 2024, including the related notes (collectively referred to as the “consolidated financial statements”). We also have audited the Company's internal control over financial reporting as of December 31, 2024, based on criteria established in Internal Control - Integrated Framework (2013) issued by the Committee of Sponsoring Organizations of the Treadway Commission (COSO).

In our opinion, the consolidated financial statements referred to above present fairly, in all material respects, the financial position of the Company as of December 31, 2024 and 2023, and the results of its operations and its cash flows for each of the three years in the period ended December 31, 2024 in conformity with accounting principles generally accepted in the United States of America. Also in our opinion, the Company maintained, in all material respects, effective internal control over financial reporting as of December 31, 2024, based on criteria established in Internal Control - Integrated Framework (2013) issued by the COSO.

Basis for Opinions

The Company's management is responsible for these consolidated financial statements, for maintaining effective internal control over financial reporting, and for its assessment of the effectiveness of internal control over financial reporting, included in Management’s Report on Internal Control over Financial Reporting appearing under Item 9A. Our responsibility is to express opinions on the Company’s consolidated financial statements and on the Company's internal control over financial reporting based on our audits. We are a public accounting firm registered with the Public Company Accounting Oversight Board (United States) (PCAOB) and are required to be independent with respect to the Company in accordance with the U.S. federal securities laws and the applicable rules and regulations of the Securities and Exchange Commission and the PCAOB.

We conducted our audits in accordance with the standards of the PCAOB. Those standards require that we plan and perform the audits to obtain reasonable assurance about whether the consolidated financial statements are free of material misstatement, whether due to error or fraud, and whether effective internal control over financial reporting was maintained in all material respects.

Our audits of the consolidated financial statements included performing procedures to assess the risks of material misstatement of the consolidated financial statements, whether due to error or fraud, and performing procedures that respond to those risks. Such procedures included examining, on a test basis, evidence regarding the amounts and disclosures in the consolidated financial statements. Our audits also included evaluating the accounting principles used and significant estimates made by management, as well as evaluating the overall presentation of the consolidated financial statements. Our audit of internal control over financial reporting included obtaining an understanding of internal control over financial reporting, assessing the risk that a material weakness exists, and testing and evaluating the design and operating effectiveness of internal control based on the assessed risk. Our audits also included performing such other procedures as we considered necessary in the circumstances. We believe that our audits provide a reasonable basis for our opinions.

Definition and Limitations of Internal Control over Financial Reporting

A company’s internal control over financial reporting is a process designed to provide reasonable assurance regarding the reliability of financial reporting and the preparation of financial statements for external purposes in accordance with generally accepted accounting principles. A company’s internal control over financial reporting includes those policies and procedures that (i) pertain to the maintenance of records that, in reasonable detail, accurately and fairly reflect the transactions and dispositions of the assets of the company; (ii) provide reasonable assurance that

38

Table of Contents

transactions are recorded as necessary to permit preparation of financial statements in accordance with generally accepted accounting principles, and that receipts and expenditures of the company are being made only in accordance with authorizations of management and directors of the company; and (iii) provide reasonable assurance regarding prevention or timely detection of unauthorized acquisition, use, or disposition of the company’s assets that could have a material effect on the financial statements.

Because of its inherent limitations, internal control over financial reporting may not prevent or detect misstatements. Also, projections of any evaluation of effectiveness to future periods are subject to the risk that controls may become inadequate because of changes in conditions, or that the degree of compliance with the policies or procedures may deteriorate.

Critical Audit Matters

The critical audit matter communicated below is a matter arising from the current period audit of the consolidated financial statements that was communicated or required to be communicated to the audit committee and that (i) relates to accounts or disclosures that are material to the consolidated financial statements and (ii) involved our especially challenging, subjective, or complex judgments. The communication of critical audit matters does not alter in any way our opinion on the consolidated financial statements, taken as a whole, and we are not, by communicating the critical audit matter below, providing a separate opinion on the critical audit matter or on the accounts or disclosures to which it relates.

Revenue Recognition from Contracts with Customers

As described in Notes 1 and 3 to the consolidated financial statements, the Company’s total consolidated net sales was $5.3 billion for the year ended December 31, 2024. The Company's Specialty Distribution segment recognizes revenue when title to products and risk of loss transfers to customers. This represents the point in time when the customer is able to direct the use of and obtain substantially all the benefits from the product. The determination of when control is deemed transferred depends on the delivery terms that are agreed upon in the contract. The Company's Installation segment recognizes revenue over time as the related performance obligation is satisfied with respect to each particular order within a given customer’s contract. Progress toward complete satisfaction of the performance obligation is measured using a cost-to-cost measure of progress method. The cost input is based on the amount of material installed at that customer’s location and the associated labor costs, as compared to the total expected cost for the order. Generally, this results in revenue from the Installation segment being recognized as the customer is able to receive and utilize the benefits provided by the Company’s services. The transaction price is the amount of consideration the Company expects to receive based on the arrangement with the customer.

The principal consideration for our determination that performing procedures relating to revenue recognition from contracts with customers is a critical audit matter is a high degree of auditor effort in performing procedures related to the Company's revenue recognition. Addressing the matter involved performing procedures and evaluating audit evidence in connection with forming our overall opinion on the consolidated financial statements. These procedures included testing the effectiveness of controls relating to the Company’s revenue recognition process.

These procedures also included, among others (i) testing revenue recognized for a sample of revenue transactions by obtaining and inspecting source documents such as signed work agreements, purchase orders, contracts and change orders, proof of shipment or receipt, evidence of performance of work, and cash receipts, as applicable and (ii) testing a sample of outstanding customer invoice balances as of December 31, 2024 by obtaining and inspecting source documents, such as contracts, proof of shipment or receipt, evidence of performance of work and subsequent cash receipts, as applicable.

/s/ PricewaterhouseCoopers LLP

Tampa, Florida

February 25, 2025

We have served as the Company’s auditor since 2015.

39

Table of Contents

TOPBUILD CORP.

CONSOLIDATED BALANCE SHEETS

(In thousands except share amounts)

As of December 31,

2024

2023

ASSETS

Current assets:

Cash and cash equivalents

$

400,318

$

848,565

Receivables, net of an allowance for credit losses of $18,541 at December 31, 2024, and $23,948 at December 31, 2023

751,612


799,009

Inventories

406,662


364,731

Prepaid expenses and other current assets

40,382


36,939

Total current assets

1,598,974


2,049,244

Right of use assets

189,146

204,629

Property and equipment, net

266,992


264,487

Goodwill

2,112,259


2,042,568

Other intangible assets, net

557,689


591,058

Other assets

10,366


10,865

Total assets

$

4,735,426

$

5,162,851

LIABILITIES AND EQUITY

Current liabilities:

Accounts payable

$

456,446

$

469,585

Current portion of long-term debt

48,750

47,039

Accrued liabilities

191,786

187,217

Short-term operating lease liabilities

68,713

65,780

Short-term finance lease liabilities

1,487

1,917

Total current liabilities

767,182

771,538

Long-term debt

1,327,159

1,373,028

Deferred tax liabilities, net

240,343

243,930

Long-term portion of insurance reserves

57,700

58,783

Long-term operating lease liabilities

129,360

146,213

Long-term finance lease liabilities

2,618

4,150

Other liabilities

1,446

1,554

Total liabilities

2,525,808

2,599,196

Commitments and contingencies

Equity:

Preferred stock, $0.01 par value: 10,000,000 shares authorized; 0 shares issued and outstanding

-

-

Common stock, $0.01 par value: 250,000,000 shares authorized; 39,554,033 shares issued and 29,367,087 outstanding at December 31, 2024, and 39,492,037 shares issued and 31,776,039 outstanding at December 31, 2023

396

394

Treasury stock, 10,186,946 shares at December 31, 2024, and 7,715,998 shares at December 31, 2023, at cost

(1,681,230)

(699,327)

Additional paid-in capital

926,137

906,334

Retained earnings

2,993,521

2,370,919

Accumulated other comprehensive loss

(29,206)

(14,665)

Total equity

2,209,618

2,563,655

Total liabilities and equity

$

4,735,426

$

5,162,851

See notes to our consolidated financial statements.

40

Table of Contents

TOPBUILD CORP.

CONSOLIDATED STATEMENTS OF OPERATIONS

(In thousands except share and per common share amounts)

Year Ended December 31, 

2024

2023

2022

Net sales

$

5,329,803


$

5,194,694

$

5,008,744

Cost of sales

3,704,885

3,590,874

3,522,025

Gross profit

1,624,918

1,603,820

1,486,719

Selling, general, and administrative expense

738,575

724,995

689,555

Operating profit

886,343

878,825

797,164

Other income (expense), net:

Interest expense

(73,092)

(74,614)

(56,716)

Other, net

27,537

21,272

1,687

Other expense, net

(45,555)

(53,342)

(55,029)

Income before income taxes

840,788

825,483

742,135

Income tax expense

(218,186)

(211,229)

(186,146)

Net income

$

622,602

$

614,254

$

555,989

Net income per common share:

Basic

$

20.41

$

19.44

$

17.26

Diluted

$

20.29

$

19.33

$

17.14

Weighted average shares outstanding:

Basic

30,504,064

31,597,508

32,213,839

Diluted

30,679,660

31,776,901

32,440,405

See notes to our consolidated financial statements.

41

Table of Contents

TOPBUILD CORP.

CONSOLIDATED STATEMENTS OF COMPREHENSIVE INCOME

(In thousands)

Year Ended December 31, 

2024

2023

2022

Net income

$

622,602

$

614,254

$

555,989

Other comprehensive (loss) income:

Foreign currency translation adjustment

(14,541)

7,255

(15,286)

Comprehensive income

$

608,061

$

621,509

$

540,703

See notes to our consolidated financial statements.

42

Table of Contents

TOPBUILD CORP.

CONSOLIDATED STATEMENTS OF CASH FLOWS

(In thousands)

Year Ended December 31, 

2024

2023

2022

Cash Flows Provided by (Used in) Operating Activities:


Net income

$

622,602

$

614,254

$

555,989

Adjustments to reconcile net income to net cash provided by operating activities:

Depreciation and amortization

140,491

132,878

123,335

Share-based compensation

16,579

15,838

12,310

Loss on sale of assets

1,014

2,349

1,833

Amortization of debt issuance costs

2,881

2,881

2,867

Provision for bad debt expense

15,742

6,481

5,510

Provision for inventory obsolescence

7,586

4,794

6,659

Deferred income taxes, net

(3,462)

(7,476)

6,041

Change in certain assets and liabilities, net of effects of businesses acquired:

Receivables, net

56,017

20,812

(169,327)

Inventories

(41,723)

74,529

(93,874)

Prepaid expenses and other current assets

(3,143)

(2,598)

(9,222)

Accounts payable

(30,420)

(8,867)

26,581

Accrued liabilities

(5,816)

(4,444)

20,703

Other, net

(2,322)

(2,022)

6,396

Net cash provided by operating activities

776,026

849,409

495,801

Cash Flows Provided by (Used in) Investing Activities:

Purchases of property and equipment

(69,349)

(63,998)

(76,382)

Acquisition of businesses, net of cash acquired

(136,767)

(149,154)

(20,500)

Proceeds from sale of assets

2,593

14,982

2,975

Net cash used in investing activities

(203,523)

(198,170)

(93,907)

Cash Flows Provided by (Used in) Financing Activities:

Repayment of long-term debt

(47,039)

(40,138)

(38,658)

Proceeds from revolving credit facility

70,000

Repayment of revolving credit facility

(70,000)

Taxes withheld and paid on employees' equity awards

(6,107)

(6,528)

(11,719)

Exercise of stock options

3,226

3,130

2,028

Repurchase of shares of common stock

(966,352)

(250,050)

Payment of contingent consideration

(300)

(1,674)

Net cash used in financing activities

(1,016,272)

(43,836)

(300,073)

Impact of exchange rate changes on cash

(4,478)

1,093

(1,531)

Net (decrease) increase in cash and cash equivalents

(448,247)

608,496

100,290

Cash and cash equivalents - Beginning of period


848,565


240,069


139,779

Cash and cash equivalents - End of period

$

400,318

$

848,565

$

240,069

Supplemental disclosure of cash paid for:

Interest

$

69,975

$

71,463

$

49,888

Income taxes

219,484

220,773

186,722

Supplemental disclosure of noncash activities:

Leased assets obtained in exchange for new operating lease liabilities

$

50,502

$

56,255

$

103,997

Accruals for property and equipment

1,023

912

141

Excise taxes capitalized to treasury stock

9,444

See notes to our consolidated financial statements.

43

Table of Contents

TOPBUILD CORP.

CONSOLIDATED STATEMENTS OF CHANGES IN SHAREHOLDERS’ EQUITY

(In thousands, except share amounts)

Accumulated

Common

Treasury

Additional

Other

Stock

Stock

Paid-in

Retained

Comprehensive

($0.01 par value)

at cost

Capital

Earnings

(Loss) Income

Equity

Balance at December 31, 2021

$

391

$

(431,030)

$

873,031

$

1,200,676

$

(6,634)

$

1,636,434

Net income

-

-

-

555,989

-

555,989

Share-based compensation

-

-

12,310

-

-

12,310

Issuance of 168,137 restricted share awards under long-term equity incentive plan

2

-

(2)

-

-

-

Repurchase of 1,390,667 shares pursuant to the Share Repurchase Programs

-

(250,050)

-

-

-

(250,050)

53,593 shares withheld to pay taxes on employees' equity awards

-

(11,719)

-

-

-

(11,719)

25,215 shares issued upon exercise of stock options

-

-

2,028

-

-

2,028

Other comprehensive loss, net of tax

-

-

-

-

(15,286)

(15,286)

Balance at December 31, 2022

$

393

$

(692,799)

$

887,367

$

1,756,665

$

(21,920)

$

1,929,706

Net income

-

-

-

614,254

-

614,254

Share-based compensation

-

-

15,838

-

-

15,838

Issuance of 112,580 restricted share awards under long-term equity incentive plan, net of forfeitures

1

-

(1)

-

-

-

32,914 shares withheld to pay taxes on employees' equity awards

-

(6,528)

-

-

-

(6,528)

53,541 shares issued upon exercise of stock options

-

-

3,130

-

-

3,130

Other comprehensive income, net of tax

-

-

-

-

7,255

7,255

Balance at December 31, 2023

$

394

$

(699,327)

$

906,334

$

2,370,919

$

(14,665)

$

2,563,655

Net income

-

-

-

622,602

-

622,602

Share-based compensation

-

-

16,579

-

-

16,579

Issuance of 45,970 restricted share awards under long-term equity incentive plan, net of forfeitures

2

-

(2)

-

-

-

Repurchase of 2,455,872 shares pursuant to the Share Repurchase Programs

(975,796)

(975,796)

15,076 shares withheld to pay taxes on employees' equity awards

-

(6,107)

-

-

-

(6,107)

16,026 shares issued upon exercise of stock options

-

-

3,226

-

-

3,226

Other comprehensive loss, net of tax

-

-

-

-

(14,541)

(14,541)

Balance at December 31, 2024

$

396

$

(1,681,230)

$

926,137

$

2,993,521

$

(29,206)

$

2,209,618

See notes to our consolidated financial statements.

44

Table of Contents

TOPBUILD CORP.
NOTES TO CONSOLIDATED FINANCIAL STATEMENTS

1. SUMMARY OF SIGNIFICANT ACCOUNTING POLICIES

Basis of Presentation.  TopBuild is a Delaware corporation and trades on the NYSE under the symbol “BLD.” We report our business in two segments: Installation and Specialty Distribution.  Our Installation segment primarily installs insulation and other building products.  Our Specialty Distribution segment primarily sells and distributes insulation and other building products.  Our segments are based on our operating units, for which further discussion is included in Note 8 – Segment Information.

Financial Statement Presentation.  The Consolidated Financial Statements have been developed in conformity with GAAP.  All intercompany transactions between the TopBuild entities have been eliminated.  

Use of Estimates and Assumptions in the Preparation of Financial Statements.  The preparation of our Consolidated Financial Statements in conformity with GAAP requires us to make certain estimates and assumptions that affect the reported amounts of assets and liabilities, and disclosure of any contingent assets and liabilities, at the date of the financial statements, and the reported amounts of sales and expenses during the reporting period.  Actual results may differ from these estimates and assumptions.

Revenue Recognition.  Revenue is disaggregated between our Installation and Specialty Distribution segments. A reconciliation of disaggregated revenue by segment is included in Note 8 – Segment Information.

We recognize revenue for our Installation segment over time as the related performance obligation is satisfied with respect to each particular order within a given customer’s contract. Progress toward complete satisfaction of the performance obligation is measured using a cost-to-cost measure of progress method. The cost input is based on the amount of material installed at that customer’s location and the associated labor costs, as compared to the total expected cost for the particular order.  The total expected cost is an estimate in the revenue recognition process which requires judgment and is subject to variability throughout the duration of the contract as a result of contract modifications and other circumstances impacting job completion. Generally, this results in revenue being recognized as the customer is able to receive and utilize the benefits provided by our services. Each contract contains one or more individual orders, which are based on services delivered. When material and installation services are bundled in a contract, we combine these items into one performance obligation as the overall promise is to transfer the combined item.

Revenue from our Specialty Distribution segment is recognized when title to products and risk of loss transfers to our customers.  This represents the point in time when the customer is able to direct the use of and obtain substantially all the benefits from the product. The determination of when control is deemed transferred depends on the delivery terms that are agreed upon in the contract.

The transaction price is the amount of consideration we expect to receive based on the arrangement with the customer. The duration of our contracts with customers is relatively short, generally less than a 90-day period, therefore there is not a significant financing component when considering the determination of the transaction price which gets allocated to the individual performance obligations, generally based on standalone selling prices. Additionally, we consider shipping costs charged to a customer as a fulfillment cost rather than a promised service and expense as incurred. Sales taxes, when incurred, are recorded as a liability and excluded from revenue on a net basis.

We record a contract asset when we have satisfied our performance obligation prior to billing and a contract liability when a customer payment is received prior to the satisfaction of our performance obligation. The difference between the beginning and ending balances of our contract assets and liabilities primarily results from the timing of our performance and the customer’s payment. See Note 3 – Revenue Recognition for more information.

45

Table of Contents

TOPBUILD CORP.
NOTES TO CONSOLIDATED FINANCIAL STATEMENTS

Business Combinations.  The purchase price for business combinations is allocated to the estimated fair values of acquired tangible and intangible assets, including goodwill, and assumed liabilities, where applicable.  Additionally, we recognize customer relationships, trademarks and trade names, and non-compete agreements as identifiable intangible assets, which are recorded at fair value as of the transaction date. The fair value of the customer relationships intangible assets are determined by management using the multi-period excess earnings method under the income approach. Assumptions used in determining the fair value of the customer relationships intangible asset include forecasted revenue growth rate, customer attrition rate, and discount rate. The fair value of other intangible assets is determined primarily using current industry information.  Goodwill is recorded when consideration transferred exceeds the fair value of identifiable assets and liabilities.  Measurement-period adjustments to assets acquired and liabilities assumed with a corresponding offset to goodwill are recorded in the period they occur, which may include up to one year from the acquisition date.  Contingent consideration is recorded at fair value at the acquisition date.

Cash and Cash Equivalents.  We consider our highly liquid investments with a maturity of three months or less at the time of purchase to be cash and cash equivalents.

Receivables, net.  We do business with a significant number of customers, principally homebuilders and contractors.  We monitor our exposure for credit losses on our customer receivable balances and the credit worthiness of our customers on an on-going basis.  Expected credit losses are measured by segment using historical loss rate information adjusted for current conditions, with changes in the allowance recorded as a provision for (or reversal of) credit loss expense. Expected losses are charged against the allowance when management believes a receivable is uncollectible. During downturns in our markets, declines in the financial condition and creditworthiness of customers impact the credit risk of the receivables involved and we have incurred additional expense related to customer defaults. Receivables, net are presented net of certain allowances, including allowance for credit losses.

Inventories.  Inventories consist primarily of insulation and insulation accessories, rain gutters, garage doors, shower enclosures, windows, shelving and other products. We value inventory at the lower of cost or net realizable value, where cost is determined by the first in-first out cost method.  Net realizable value is the estimated selling price in the ordinary course of business, less reasonably predictable cost of completion, disposal, and transportation.  Inventory value is evaluated at each balance sheet date to ensure that it is carried at the lower of cost or net realizable value.  

Inventory provisions are recorded to reduce inventory to the lower of cost or net realizable value for obsolete or slow moving inventory based on assumptions about future demand and marketability of products, the impact of new product introductions, inventory levels and turns, product spoilage, and specific identification of items such as product discontinuance, engineering/material changes, or regulatory-related changes.  Our inventory reserve balances were $14.7 million and $10.7 million as of December 31, 2024 and 2023, respectively.  As of December 31, 2024, and 2023, primarily all inventory consisted of finished goods.

Property and Equipment, net.  Property and equipment, net, including significant improvements to existing facilities, are recorded at cost.  Upon retirement or disposal, the cost and accumulated depreciation are removed from the accounts and any gain or loss is included in the Consolidated Statements of Operations.  Maintenance and repair costs are charged against earnings as incurred.  Gains and losses on the disposal of equipment are included in selling, general, and administrative expense.

We review our property and equipment as an event occurs or circumstances change that indicate the carrying value of property and equipment is below its fair value.  If the carrying amount is not recoverable from its undiscounted cash flows, we would recognize an impairment loss for the difference between the carrying amount and the current fair value.  Further, we evaluate the remaining useful lives of property and equipment at each reporting period to determine whether events and circumstances warrant a revision to the remaining depreciation periods.

46

Table of Contents

TOPBUILD CORP.
NOTES TO CONSOLIDATED FINANCIAL STATEMENTS

Depreciation.  Depreciation expense is computed principally using the straight-line method over the estimated useful lives of the assets.  Estimated useful lives are generally as follows:

Asset Class

Estimated Useful Life

Buildings and land improvements

2040 years

Software

36 years

Company vehicles

38 years

Equipment

48 years

Leases.  At the inception of a contract, we determine whether the contract is or contains a lease, based on the unique facts and circumstances present.  Our facilities operating leases and various vehicle and equipment finance leases have lease and non-lease fixed cost components, which we account for as one single lease component in calculating the present value of minimum lease payments.   Variable lease and non-lease cost components are expensed as incurred and are primarily included in cost of sales on the accompanying Consolidated Statement of Operations.

Lease payments are recognized as an expense in the Consolidated Statements of Operations on a straight-line basis over the lease term, including future option periods the Company reasonably expects to exercise, whereby an equal amount of rent expense is attributed to each period during the term of the lease, regardless of when actual payments are made.  This generally results in rent expense in excess of cash payments during the early years of a lease and rent expense less than cash payments in later years.  The difference between rent expense recognized and actual rental payments is typically represented as the spread between the ROU asset and lease liability.

We recognize a ROU asset and a lease liability at the lease commencement date.  Our leases may include options to extend or terminate the lease, which will be reflected in the calculation of the lease liability and corresponding ROU asset when it is reasonably certain that we will exercise that option. We do not recognize ROU assets and lease liabilities for short-term leases that have an initial lease term of 12 months or less.  We recognize the lease payments associated with short-term leases as an expense on a straight-line basis over the lease term.

The lease liability is initially measured as the present value of the unpaid lease payments as of the lease commencement date. The lease liability is discounted based on our incremental borrowing rate (“IBR”) at the time of modification for an existing lease or at the time of lease commencement for new leases. Our IBR includes significant assumptions regarding our secured borrowing rates and adjustments for differences in the remaining lease term, underlying assets and market conditions for companies with similar credit qualities as well as interest rate index fluctuations. The ROU asset is initially measured at cost, which comprises the initial amount of the lease liability adjusted for lease payments made at or before the lease commencement date, plus any initial direct costs incurred less any lease incentives received.  The ROU asset is subsequently measured throughout the lease term as the carrying amount of the lease liability, plus initial direct costs, plus (minus) any prepaid (accrued) lease payments, less the unamortized balance of lease incentives received.  Certain vehicle lease agreements have residual value guarantees at the end of the lease which require us to return the asset with a specified percentage of the original or other calculated value.

Fair Value.  The fair value measurement standard defines fair value as the price that would be received to sell an asset, or paid to transfer a liability, in an orderly transaction between market participants at the measurement date (referred to as an “exit price”).  A fair value hierarchy is established that prioritizes the inputs to valuation techniques used to measure fair value.  The hierarchy gives the highest priority to unadjusted quoted market prices in active markets for identical assets and liabilities (Level 1 measurements) and the lowest priority to unobservable inputs (Level 3 measurements).  The three levels of the fair value hierarchy are:

Level 1: Quoted prices in active markets for identical assets or liabilities.

Level 2: Observable inputs other than Level 1 prices, such as quoted market prices for similar assets or liabilities or other inputs that are observable or can be corroborated by market data.

47

Table of Contents

TOPBUILD CORP.
NOTES TO CONSOLIDATED FINANCIAL STATEMENTS

Level 3: Unobservable inputs in which there is little or no market data, which require the reporting entity to develop its own assumptions.

Goodwill and Other Intangible Assets.  We perform our annual impairment testing of goodwill in the fourth quarter of each year, or as events occur or circumstances change that would more likely than not reduce the fair value of a reporting unit below its carrying amount. We have defined our reporting units and completed the impairment testing of goodwill at the operating segment level.  Our operating segments are reporting units that engage in business activities for which discrete financial information, including long-range forecasts, are available.  When assessing goodwill for impairment, we have the option to first assess qualitative factors to determine whether the existence of events or circumstances leads to a determination that it is more likely than not that the fair value of a reporting unit is less than its carrying amount. If, after assessing the totality of events or circumstances, we determine it is more likely than not that the fair value of a reporting unit is less than its carrying amount, then we recognize an impairment charge for the amount by which the carrying amount exceeds the reporting unit’s fair value. If we conclude otherwise, then no further action is taken. We also have the option to bypass the qualitative assessment and only perform a quantitative assessment. For the years ended December 31, 2024 and 2023, we performed a qualitative assessment.

Fair value for our reporting units is determined using a discounted cash flow method and a market multiple approach (with a 50% weighting of each), both which include significant unobservable inputs (Level 3 inputs).  We believe these methodologies are comparable to what would be used by other market participants.  Using the discounted cash flow method requires us to make significant estimates and assumptions, including long term projections of cash flows, market conditions, and appropriate discount rates.  Our judgments are based on historical experience, current market trends, consultations with external valuation specialists and other information.  The market approach includes a comparison of the multiple of a reporting unit's carrying value to its earnings before interest, taxes, depreciation and amortization with the multiples of similar businesses or guideline companies whose securities are actively traded in the public markets.  While we believe that the estimates and assumptions underlying the valuation methodologies are reasonable, changes to estimates and assumptions could result in different outcomes.  In estimating future cash flows, we rely on internally generated long-range forecasts for sales and operating profits, and generally a one to three percent long term assumed annual growth rate of cash flows for periods after the long-range forecast.  We generally develop these forecasts based upon, among other things, recent sales data for existing products, and estimated U.S. housing starts.

Intangible assets with finite useful lives are amortized using the straight-line method over their estimated useful lives.  We evaluate the remaining useful lives of amortizable intangible assets at each reporting period to determine whether events and circumstances warrant a revision to the remaining periods of amortization.  For additional information, see Note 5 – Goodwill and Other Intangibles.

Insurance Reserves.  We use a combination of high deductible and matching deductible insurance programs for a number of risks including, but not limited to, workers’ compensation, general liability, vehicle, and property liabilities. Our workers’ compensation insurance is primarily a high-deductible insurance program and our primary general liability insurance is a matching deductible program. We are insured for covered claims above the deductibles and retentions on an excess basis. The liabilities represent our best estimate of our costs, using generally accepted actuarial reserving methods, of the ultimate obligations for reported claims plus those incurred but not reported claims through December 31, 2024 and 2023. The accruals are adjusted as new information develops or circumstances change that would affect the estimated liability. We also record an insurance receivable for claims that exceeded the stop loss limit included in Other assets on our Consolidated Balance Sheets which offsets an equal liability included within Long-term portion of insurance reserves on our Consolidated Balance Sheets. At December 31, 2024 and 2023, the amount of this receivable and liability was $10.4 million.

Advertising.  Advertising costs are expensed as incurred.  Advertising expense, net of manufacturers support, was approximately $1.5 million, $3.0 million, and $2.9 million for the years ended December 31, 2024, 2023 and 2022, respectively, and is included in selling, general, and administrative expense.

48

Table of Contents

TOPBUILD CORP.
NOTES TO CONSOLIDATED FINANCIAL STATEMENTS

Share-based Compensation.  Our share-based compensation program currently consists of RSAs and stock options.  Share-based compensation expense is reported in selling, general, and administrative expense.  We do not capitalize any compensation cost related to share-based compensation awards.  The income tax benefits and expenses associated with share-based awards are reported as a component of income tax expense.  Excess tax benefits and deficiencies are included in net cash provided by (used in) operating activities while shares withheld for tax-withholding are reported in financing activities under the caption “Taxes withheld and paid on employees’ equity awards” in our Consolidated Statements of Cash Flows.  Award forfeitures are accounted for in the period they occur.  

The following table summarizes certain information regarding our restricted share awards and our stock options:

Award Type:

Fair Value Determination

Vesting

Expense
Recognition‡

Expense
Measurement

Restricted Share Awards

Service Condition

Closing stock price on date of grant

Ratably;
3 or 5 years

Straight-line

Fair value at grant date

Performance Condition

Closing stock price on date of grant

Cliff;
3 years

Straight-line;
Adjusted based on meeting or exceeding performance targets

Evaluated quarterly;
0 - 200% of fair value at grant date depending on performance

Market Condition

Monte-Carlo Simulation

Cliff;
3 years

Straight-line;
Recognized even if condition is not met

Fair value at grant date

Stock Options†

Black-Scholes Options Pricing Model

Ratably;
3 or 5 years

Straight-line

Fair value at grant date

†Stock options expire no later than 10 years after the grant date.

‡Expense is reversed if award is forfeited prior to vesting.

Debt Issuance Costs.  Debt issuance costs are amortized to interest expense over the life of the respective debt, which approximates the effective interest rate method.  Unamortized debt issuance costs are presented as a direct deduction from the related debt on our Consolidated Balance Sheets.

Income Taxes.  We account for income taxes using the asset and liability method, which requires recognition of deferred tax assets and liabilities for expected future tax consequences of temporary differences that currently exist between tax basis and financial reporting basis of our assets and liabilities. Deferred tax assets and liabilities are measured using enacted tax rates in the respective jurisdictions in which we operate.

Valuation allowances are established against deferred tax assets when it is more likely than not that the realization of those deferred tax assets will not occur. In evaluating our ability to recover our deferred tax assets within the jurisdiction from which they arise, we consider all available positive and negative evidence. If, based upon all available evidence, both positive and negative, it is more likely than not (more than 50 percent likely) such deferred tax assets will not be realized, a valuation allowance is recorded. Significant weight is given to positive and negative evidence that is objectively verifiable.

Only those income tax positions that have a greater than 50 percent likelihood of being sustained upon examination by taxing authorities are recognized. There is an increased potential for volatility in our effective tax rate because of future changes in the income tax environment and the inherent complexities of income tax law in the various jurisdictions. Accordingly, provisions for tax-related matters, including interest and penalties, could be recorded in income tax expense in the period revised assessments are made.

49

Table of Contents

TOPBUILD CORP.
NOTES TO CONSOLIDATED FINANCIAL STATEMENTS

While we believe we have adequately assessed for our uncertain tax positions, amounts asserted by taxing authorities could vary from our assessment of uncertain tax positions.  Accordingly, provisions for tax-related matters, including interest and penalties, could be recorded in income tax expense in the period revised assessments are made.  These unrecognized tax positions including associated interest and penalties are not material to our consolidated financial statements for the periods presented.

Additionally, we generally do not provide for taxes related to undistributed earnings as such earnings would not be taxable when remitted or would be considered to be indefinitely reinvested.

Foreign Currency.  Foreign currency assets and liabilities are translated into United States dollars using the exchange rates in effect at the end of each reporting period. Equity accounts are translated at historical rates, except for the change in retained earnings during the year, which is the result of the income statement translation process. Revenue and expense accounts are translated using the weighted average exchange rate during the period. The cumulative translation adjustments associated with the net assets of foreign subsidiaries are recorded in accumulated other comprehensive (loss) income on our Consolidated Statement of Shareholders’ Equity. Net foreign currency transaction gains and losses arising during the normal course of business are included in Other, net on our Consolidated Statement of Operations.

Recently Adopted Accounting Pronouncements

Segment Reporting. In November 2023, the FASB issued ASU 2023-07, “Segment Reporting (Topic 280), Improvements to Reportable Segment Disclosures”.  This standard amends Topic 280 to require all entities to disclose, on an annual and interim basis, significant segment expenses and an amount for other segment items by reportable segment. This standard became effective for us in this Annual Report.  Its adoption had no impact on our consolidated results of operations, financial position or cash flows. See Note 8 – Segment Information for required disclosures.

Recently Issued Accounting Pronouncements Not Yet Adopted

In December 2023, the FASB issued ASU 2023-09, “Income Taxes (Topic 740), Improvements to Income Tax Disclosures”. This standard amends Topic 740 to require all entities to disclose specific categories in the rate reconciliation, income taxes paid and other income tax information.  This standard is effective for fiscal years beginning after December 15, 2024, with early adoption permitted and should be applied on a prospective basis.  We do not anticipate that this standard will affect our consolidated results of operations, financial position or cash flows and we are assessing the impact of its adoption in our disclosures to our consolidated financial statements.

In November 2024, the FASB issued ASU 2024-03, “Income Statement – Reporting Comprehensive Income – Expense Disaggregation Disclosures (Subtopic 220-40)”. This standard requires disclosure, in the notes to financial statements, of specified information about certain costs and expenses. This standard is effective for annual reporting periods beginning after December 15, 2026, and interim reporting periods beginning after December 15, 2027, with early adoption permitted. This standard may be applied either prospectively or retrospectively. We do not anticipate that this standard will affect our consolidated results of operations, financial position or cash flows and we are assessing the impact of its adoption in our disclosures to our consolidated financial statements.

2.  LEASES

We lease various assets to support our business including warehouses for our installation branch locations and specialty distribution centers, office space for our Branch Support Center in Daytona Beach, Florida and other administrative locations, as well as fleet vehicles and certain equipment. In addition, we lease certain operating facilities from related parties, primarily former owners (and in certain cases, current management personnel) of companies acquired. These related party leases are immaterial to our Consolidated Statements of Operations.

50

Table of Contents

TOPBUILD CORP.
NOTES TO CONSOLIDATED FINANCIAL STATEMENTS

The following table presents lease-related assets and liabilities and their classification on our Consolidated Balance Sheets, in thousands:


As of December 31, 

2024

2023

Assets

Classification

Operating

Right of use assets

$

189,146

$

204,629

Finance

Property and equipment, net

3,771

5,577

Total lease assets

$

192,917

$

210,206

Liabilities

Current

Operating

Short-term operating lease liabilities

$

68,713

$

65,780

Finance

Short-term finance lease liabilities

1,487

1,917

Non-Current

Operating

Long-term operating lease liabilities

129,360

146,213

Finance

Long-term finance lease liabilities

2,618

4,150

Total lease liabilities

$

202,178

$

218,060

As of December 31, 

2024

2023

Weighted-average remaining lease term:

Operating leases

3.4 years

3.6 years

Finance leases

3.2 years

3.8 years

Weighted-average discount rate:

Operating leases

4.9

%

4.0

%

Finance leases

3.5

%

3.3

%

The components of lease expense were as follows and are primarily included in cost of sales and in selling, general and administrative expenses on the accompanying Consolidated Statement of Operations for finance leases and operating leases, in thousands:

Year Ended December 31, 

2024

2023

2022

Operating lease cost (a)

$

95,276

$

88,292

75,366

Financing lease cost:

Amortization of leased assets

1,765

2,188

2,815

Interest on finance lease obligations

166

210

268

Short-term lease cost

25,806

24,275

18,315

Sublease income

(1,219)

(1,022)

(780)

Net lease cost

$

121,794

$

113,943

$

95,984

(a)Includes variable cost components of $18,312, $16,162 and $14,451 in the years ended December 31, 2024, 2023, and 2022, respectively.

51

Table of Contents

TOPBUILD CORP.
NOTES TO CONSOLIDATED FINANCIAL STATEMENTS

Future minimum lease payments under non-cancellable operating and finance leases as of December 31, 2024, were as follows, in thousands:

Payments due by Period


2025

$

78,423

2026

61,038

2027

42,634

2028

24,086

2029

11,896

2030 and Thereafter

3,359

Total future minimum lease payments

221,436

Less: imputed interest

(19,258)

Lease liability at December 31, 2024

$

202,178

The amounts below are included in the cash flows provided by operating activities section on the accompanying Consolidated Statement of Cash Flows, in thousands:


Year Ended December 31, 

2024

2023

2022

Cash paid for amounts included in the measurement of lease liabilities:

Operating cash flows from finance leases

$

(166)

$

(210)

$

(268)

Operating cash flows from operating leases

(76,192)

(71,667)

(74,135)

Financing cash flows from finance leases

(1,934)

(2,776)

(2,361)

3. REVENUE RECOGNITION

Revenue is disaggregated between our Installation and Specialty Distribution segments and further based on market and product, as we believe this best depicts how the nature, amount, timing, and uncertainty of revenue and cash flows are affected by economic factors.  The following tables present our revenues disaggregated by market (in thousands):

Year Ended December 31, 2024

Installation

Specialty Distribution

Eliminations

Total

Residential

$

2,762,703

$

945,916

$

(260,279)

$

3,448,340

Commercial/Industrial

531,927

1,394,921

(45,385)

1,881,463

  Net sales

$

3,294,630

$

2,340,837

$

(305,664)

$

5,329,803

Year Ended December 31, 2023

Installation

Specialty Distribution

Eliminations

Total

Residential

$

2,672,152

$

897,783

$

(219,932)

$

3,350,003

Commercial/Industrial

516,080

1,370,556

(41,945)

1,844,691

  Net sales

$

3,188,232

$

2,268,339

$

(261,877)

$

5,194,694

Year Ended December 31, 2022

Installation

Specialty Distribution

Eliminations

Total

Residential

$

2,503,123

$

967,687

$

(198,809)

$

3,272,001

Commercial/Industrial

466,855

1,310,574

(40,686)

1,736,743

  Net sales

$

2,969,978

$

2,278,261

$

(239,495)

$

5,008,744

52

Table of Contents

TOPBUILD CORP.
NOTES TO CONSOLIDATED FINANCIAL STATEMENTS

The following tables present our revenues disaggregated by product (in thousands):

Year Ended December 31, 2024

Installation

Specialty Distribution

Eliminations

Total

Insulation and accessories

$

2,644,819

$

2,077,253

$

(268,916)

$

4,453,156

Glass and windows

246,929

-

-

246,929

Gutters

118,908

193,353

(32,000)

280,261

All other

283,974

70,231

(4,748)

349,457

       Net sales

$

3,294,630

$

2,340,837

$

(305,664)

$

5,329,803

Year Ended December 31, 2023

Installation

Specialty Distribution

Eliminations

Total

Insulation and accessories

$

2,529,186

$

2,028,467

$

(228,100)

$

4,329,553

Glass and windows

251,001

-

-

251,001

Gutters

114,293

175,765

(29,806)

260,252

All other

293,752

64,107

(3,971)

353,888

       Net sales

$

3,188,232

$

2,268,339

$

(261,877)

$

5,194,694

Year Ended December 31, 2022

Installation

Specialty Distribution

Eliminations

Total

Insulation and accessories

$

2,344,807

$

2,019,108

$

(204,849)

$

4,159,066

Glass and windows

227,318

-

-

227,318

Gutters

106,969

189,800

(30,412)

266,357

All other

290,884

69,353

(4,234)

356,003

       Net sales

$

2,969,978

$

2,278,261

$

(239,495)

$

5,008,744

The following table represents our contract assets and contract liabilities with customers, in thousands:

Included in Line Item on

As of December 31,

Consolidated Balance Sheets

2024

2023

Contract Assets:

Receivables, unbilled

Receivables, net

$

61,366

$

64,882

Contract Liabilities:

Deferred revenue

Accrued liabilities

$

18,651

$

18,365

The aggregate amount remaining on uncompleted performance obligations was $345.7 million as of December 31, 2024. We expect to satisfy the performance obligations and recognize revenue on substantially all of these uncompleted contracts over the next 18 months.

On certain of our long-term contracts, a percentage of the total project cost is withheld and not invoiced to the customer and collected until satisfactory completion of the customer’s project, typically within a year. This amount is referred to as retainage and is common practice in the construction industry. Retainage receivables are classified as a component of Receivables, net on our Consolidated Balance Sheets and were $74.9 million and $81.9 million as of December 31, 2024 and 2023, respectively.

53

Table of Contents

TOPBUILD CORP.
NOTES TO CONSOLIDATED FINANCIAL STATEMENTS

4.  PROPERTY & EQUIPMENT

The following table sets forth our property and equipment by class as of December 31, 2024 and 2023, in thousands:

As of December 31, 

2024

2023

Land and improvements

$

7,348

$

7,463

Buildings

47,569

47,384

Equipment

179,187

165,227

Computer hardware and software

164,598

173,709

Company vehicles

286,994

250,561

685,696

644,344

Less:  Accumulated depreciation

(422,475)

(385,435)

Total property and equipment, net

$

263,221

$

258,909

For additions to property and equipment as a result of 2024 acquisitions, see Note 15 – Business Combinations. As of December 31, 2024 and 2023, property and equipment, net on our Consolidated Balance Sheet includes $3.8 million and $5.6 million right of use assets on finance leases, respectively, which is disclosed further in Note 2 – Leases.

Depreciation expense was $66.6 million, $61.6 million and $52.9 million for the years ended December 31, 2024, 2023 and 2022, respectively.

5.  GOODWILL AND OTHER INTANGIBLES

We have two reporting units which are also our operating and reporting segments: Installation and Specialty Distribution.  Both reporting units contain goodwill.  Assets acquired and liabilities assumed are assigned to the applicable reporting unit based on whether the acquired assets and liabilities relate to the operations of such unit and determination of its fair value.  Goodwill assigned to the reporting unit is the excess of the fair value of the acquired business over the fair value of the individual assets acquired and liabilities assumed for the reporting unit.


In the fourth quarters of 2024 and 2023, we performed annual assessments of our goodwill resulting in no indicators of impairment.

Changes in the carrying amount of goodwill for the years ended December 31, 2024 and 2023, by segment, were as follows, in thousands:


   Accumulated   


Gross Goodwill

FX Translation

Gross Goodwill

Impairment

Net Goodwill

December 31, 2023

Additions

Adjustment

December 31, 2024

Losses

December 31, 2024

Goodwill, by segment:

Installation

$

1,901,160

$

45,087

$

-

$

1,946,247

$

(762,021)

$

1,184,226

Specialty Distribution


903,429


29,760

(5,156)


928,033


-


928,033

Total goodwill

$

2,804,589

$

74,847

$

(5,156)

$

2,874,280

$

(762,021)

$

2,112,259

54

Table of Contents

TOPBUILD CORP.
NOTES TO CONSOLIDATED FINANCIAL STATEMENTS


   Accumulated   


Gross Goodwill

FX Translation

Gross Goodwill

Impairment

Net Goodwill

December 31, 2022

Additions

Adjustment

December 31, 2023

Losses

December 31, 2023

Goodwill, by segment:

Installation

$

1,826,979

$

74,181

$

-

$

1,901,160

$

(762,021)

$

1,139,139

Specialty Distribution


902,036


-

1,393


903,429


-


903,429

Total goodwill

$

2,729,015

$

74,181

$

1,393

$

2,804,589

$

(762,021)

$

2,042,568

The following table sets forth our other intangible assets, in thousands:  

As of December 31,

2024

2023

2022

Gross definite-lived intangible assets


$

864,693

$

827,793

$

782,316

Accumulated amortization


(307,004)

(236,735)

(167,349)

Other intangible assets, net

$

557,689

$

591,058

$

614,967

Amortization expense

$

72,082

$

69,139

$

67,620

The following table sets forth a detail of our intangible assets as of December 31, 2024, in thousands:


Gross Definite-Lived Intangible Assets


Accumulated Amortization


Net Definite-Lived Intangible Assets

Trademarks

$

46,590

$

(20,623)

$

25,967

Customer relationships

810,184

(278,586)

531,598

Non-compete

7,919

(7,795)

124

Total

$

864,693

$

(307,004)

$

557,689

The following table sets forth a detail of our intangible assets as of December 31, 2023, in thousands:


Gross Definite-Lived Intangible Assets


Accumulated Amortization


Net Definite-Lived Intangible Assets

Trademarks

$

46,775

$

(18,951)

$

27,824

Customer relationships

773,099

(210,029)

563,070

Non-compete

7,919

(7,755)

164

Total

$

827,793

$

(236,735)

$

591,058

The following table sets forth the amortization expense related to the definite-lived intangible assets during each of the next five years, in thousands:


Amortization
Expense

2025

$

72,266

2026

71,794

2027

66,193

2028

64,630

2029

64,607

55

Table of Contents

TOPBUILD CORP.
NOTES TO CONSOLIDATED FINANCIAL STATEMENTS

6. LONG-TERM DEBT

The following table reconciles the principal balances of our outstanding debt to our Consolidated Balance Sheets, in thousands:

As of December 31, 

2024


2023

3.625% Senior Notes due 2029

$

400,000

$

400,000

4.125% Senior Notes due 2032

500,000

500,000

Term loan due 2026

487,500

532,500

Equipment notes

-

2,039

Unamortized debt issuance costs

(11,591)

(14,472)

Total debt, net of unamortized debt issuance costs

1,375,909

1,420,067

Less: current portion of long-term debt

48,750

47,039

Total long-term debt

$

1,327,159

$

1,373,028

The following table sets forth our remaining principal payments for our outstanding debt balances as of December 31, 2024, in thousands:

2025

2026

2027

2028

2029

Thereafter

Total

3.625% Senior Notes

$

-

$

-

$

-

$

-

$

400,000

$

-

$

400,000

4.125% Senior Notes

-

-

-

-

-

500,000

500,000

Term loan

48,750

438,750

-

-

-

-

487,500

Total

$

48,750

$

438,750

$

-

$

-

$

400,000

$

500,000

$

1,387,500

Credit Agreement

On July 26, 2023, we entered into Amendment No. 4 to our Credit Agreement, which provided for a new $550.0 million Term Facility Two, the proceeds of which were intended to be used, in part, to finance the acquisition of SPI, including the payment of related fees and expenses. On April 22, 2024, we agreed to a mutual termination of our previous agreement to acquire SPI. In connection with the termination of the SPI acquisition, the Company terminated the commitments with respect to its undrawn Term Facility Two which was provided pursuant to Amendment No. 4. All other terms of the Company’s Credit Agreement, as amended, remain in full force and effect.

The following table outlines the key terms of the Credit Agreement (dollars in thousands):

Senior secured term loan facility

$

600,000

Revolving facility (a)

$

500,000

Sublimit for issuance of letters of credit under revolving facility

$

100,000

Sublimit for swingline loans under revolving facility

$

35,000

Interest rate as of December 31, 2024

5.46

%

Scheduled maturity date

10/7/2026

(a)Use of the sublimits for the issuance of letters of credit and swingline loans reduces the availability under the revolving facility.

56

Table of Contents

TOPBUILD CORP.
NOTES TO CONSOLIDATED FINANCIAL STATEMENTS

Interest expense on borrowings under the Credit Agreement is based on an applicable margin rate plus, at our option, either:  

A base rate determined by reference to the highest of either (i) the federal funds rate plus 0.50 percent, (ii) BofA’s “prime rate,” and (iii) the SOFR rate for U.S. dollar deposits with a term of one month, plus 1.00 percent (Term Facility One); or

A SOFR rate determined by reference to the costs of funds for deposits in U.S. dollars for the interest period relevant to such borrowings, subject to a floor of 0%.

The applicable margin rate is determined based on our Secured Leverage Ratio. In the case of base rate borrowings, the applicable margin rate ranges from 0.00 percent to 1.50 percent for Term Facility One and in the case of SOFR rate borrowings, the applicable margin ranges from 1.00 percent to 2.50 percent for Term Facility One. Borrowings under the Credit Agreement are prepayable at the Company’s option without premium or penalty. The Company is required to make prepayments with the net cash proceeds of certain asset sales and certain extraordinary receipts.  

Revolving Facility

The Company has outstanding standby letters of credit that secure our financial obligations related to our workers’ compensation, general insurance, and auto liability programs.  These standby letters of credit, as well as any outstanding amount borrowed under our revolving facility, reduce the availability under the revolving facility.  The following table summarizes our availability under the revolving facility, in thousands:

As of December 31, 

2024


2023

Revolving facility

$

500,000

$

500,000

Less: standby letters of credit

(63,770)

(63,770)

Availability under revolving facility

$

436,230

$

436,230

We are required to pay commitment fees to the Lenders in respect of any unutilized commitments.  The commitment fees range from 0.15 percent to 0.275 percent per annum, depending on our Secured Leverage Ratio.  We must also pay customary fees on outstanding letters of credit.

3.625% Senior Notes

The 3.625% Senior Notes are $400.0 million senior unsecured obligations and bear interest at 3.625% per year, payable semiannually in arrears on March 15 and September 15, beginning on September 15, 2021. The 3.625% Senior Notes mature on March 15, 2029, unless redeemed early or repurchased. If we undergo a change in control, we must make an offer to repurchase all of the 3.625% Senior Notes then outstanding at a repurchase price equal to 101% of their aggregate principal amount, plus accrued and unpaid interest (if any) to, but not including, the repurchase date. 

The Company may redeem the 3.625% Senior Notes, in whole or in part, at any time on or after March 15, 2024 at the redemption prices specified in the notes plus accrued and unpaid interest if redeemed during the 12 month period commencing March 15 of the years set for: 2025 – 100.906%, 2026 and thereafter – 100.000%.

4.125% Senior Notes

The 4.125% Senior Notes are $500.0 million senior unsecured obligations and bear interest at 4.125% per year, payable semiannually in arrears on February 15 and August 15, beginning on August 15, 2022. The 4.125% Senior Notes mature on February 15, 2032, unless redeemed early or repurchased. If we undergo a change in control, we must make an offer to repurchase all of the 4.125% Senior Notes then outstanding at a repurchase price equal to 101% of their aggregate principal amount, plus accrued and unpaid interest (if any) to, but not including, the repurchase date. 

57

Table of Contents

TOPBUILD CORP.
NOTES TO CONSOLIDATED FINANCIAL STATEMENTS

The Company may redeem the 4.125% Senior Notes, in whole or in part, at any time on or after October 15, 2026 at the redemption prices specified in the notes plus accrued and unpaid interest if redeemed during the 12 month period commencing on October 15 of the years set for: 2026 – 102.063%, 2027 – 101.375%, 2028 – 100.688%, 2029 and thereafter – 100.000%. The Company may also redeem a make-whole redemption of the 4.125% Senior Notes at any time prior to October 15, 2026 at the treasury rate plus 50 basis points.

Covenant Compliance

The indentures governing our 3.625% Senior Notes and our 4.125% Senior Notes (together, our “Senior Notes”) contain restrictive covenants that, among other things, generally limit the ability of the Company and certain of its subsidiaries (subject to certain exceptions) to (i) create liens, (ii) pay dividends, acquire shares of capital stock and make payments on subordinated debt, (iii) place limitations on distributions from certain subsidiaries, (iv) issue or sell the capital stock of certain subsidiaries, (v) sell assets, (vi) enter into transactions with affiliates and (vii) effect mergers.  The indentures provide for customary events of default which include (subject in certain cases to customary grace and cure periods), among others: nonpayment of principal or interest; breach of covenants or other agreements in the indenture; defaults in failure to pay certain other indebtedness; and certain events of bankruptcy or insolvency. Generally, if an event of default occurs and is continuing under the indenture, the trustee or the holders of at least 30% in aggregate principal amount of each of our Senior Notes then outstanding may declare the principal of, premium, if any, and accrued interest on the Senior Notes subject to such declaration immediately due and payable. The Senior Notes and related guarantees have not been registered under the Securities Act of 1933, and we are not required to register either the Senior Notes or the guarantees in the future.

The Credit Agreement contains certain covenants that limit, among other things, the ability of the Company to incur additional indebtedness or liens; to make certain investments or loans; to make certain restricted payments; to enter into consolidations, mergers, sales of material assets, and other fundamental changes; to transact with affiliates; to enter into agreements restricting the ability of subsidiaries to incur liens or pay dividends; or to make certain accounting changes.  The Credit Agreement contains customary affirmative covenants and events of default.

The Credit Agreement requires that we maintain a Net Leverage Ratio and minimum Interest Coverage Ratio throughout the term of the agreement.  The following table outlines the key financial covenants effective for the period covered by this Annual Report:

As of December 31, 2024

Maximum Net Leverage Ratio

3.50:1.00

Minimum Interest Coverage Ratio

3.00:1.00

Compliance as of period end

In Compliance

7.  FAIR VALUE MEASUREMENTS

The carrying values of cash and cash equivalents, receivables, net, and accounts payable are considered to be representative of their respective fair values due to the short-term nature of these instruments.

Fair value measurements were applied to our long-term debt portfolio.  We believe the carrying value of our Term Loan approximates the fair market value primarily due to the fact that the non-performance risk of servicing our debt obligations, as reflected in our business and credit risk profile, has not materially changed since we assumed our debt obligations under the Credit Agreement.  In addition, due to the floating-rate nature of our Term Loan, the market value is not subject to variability solely due to changes in the general level of interest rates as is the case with a fixed-rate debt obligation.

58

Table of Contents

TOPBUILD CORP.
NOTES TO CONSOLIDATED FINANCIAL STATEMENTS

Based on active market trades of our 3.625% Senior Notes and our 4.125% Senior Notes close to December 31, 2024 (Level 1 fair value measurements), we estimate the fair value of each in the table below:

As of December 31, 2024

Fair Value

Gross Carrying Value

3.625% Senior Notes

$

370,000

$

400,000

4.125% Senior Notes

$

450,000

$

500,000

During all periods presented, there were no transfers between fair value hierarchy levels.

8. SEGMENT INFORMATION

Our business consists of two reportable segments: Installation and Specialty Distribution. We operate primarily in the U.S. and to a lesser extent Canada.

Our Installation segment installs insulation and other building products. Installation sells primarily to the residential new construction market, with increasing activity in the commercial/industrial construction market, along with repair/remodel of residential housing. In addition to insulation, it installs other building products including glass and windows, rain gutters, garage doors, closet shelving, and fireplaces, among other items.  

Our Specialty Distribution segment distributes building and mechanical insulation, insulation accessories and other building product materials for the residential and commercial/industrial end markets. In addition to insulation and accessories, it distributes rain gutters, closet shelving, and roofing materials, among other items. Distributed products are sold from distribution centers in various parts of the United States and Canada, primarily to contractors and dealers (including lumber yards) serving a wide variety of commercial/industrial markets.

The accounting policies of our segments are described in Note 1 – Summary of Significant Accounting Policies.  Intercompany sales from the Specialty Distribution segment to the Installation segment are recorded by the Specialty Distribution segment with a profit margin and by our Installation segment at cost. This intercompany profit is eliminated in consolidation.

Our CODM is our Chief Executive Officer. Our CODM measures performance for our reportable segments based on segment net sales and operating profit. Our CODM uses these measures to evaluate resource allocation and other strategic initiatives (e.g., making acquisitions and internal investments). Segment performance measures are compared to budgeted and forecasted amounts periodically to assist in evaluating performance versus expectations and to inform future allocation and strategic decisions.

59

Table of Contents

TOPBUILD CORP.
NOTES TO CONSOLIDATED FINANCIAL STATEMENTS

Key information is presented below by segment for our profit measures for the years ended December 31, 2024, 2023 and 2022, in thousands:

For the Year Ended December 31, 2024

Installation

Specialty Distribution

Total

Net sales from external customers

$

3,294,630

$

2,035,173

$

5,329,803

Intercompany net sales

305,664

305,664

Segment net sales

3,294,630

2,340,837

5,635,467

Reconciliation of Net Sales

Elimination of intercompany net sales

(305,664)

Consolidated net sales

$

5,329,803

Less (a):

Cost of sales (b)

2,204,269

1,756,447

3,960,716

Selling, general and administrative expenses (c)

441,199

231,959

673,158

Segment operating profit

649,162

352,431

1,001,593

Reconciliation of Segment Operating Profit

Elimination of intercompany profit

(49,834)

General corporate expense, net (d)

(65,416)

Other expense, net (e)

(45,555)

Consolidated income before taxes

$

840,788

(a) The significant expense categories align with the segment-level information that is regularly provided to our CODM.

(b) Cost of sales is primarily composed of labor, material costs and overhead.

(c) Selling, general and administrative expenses include allocation of corporate overhead, bad debt, bank fees, selling expenses, employee compensation, insurance, legal and consulting, office equipment & supplies, telecommunication & subscriptions, and travel & entertainment.

(d) General corporate expense, net includes expenses for functions such as corporate human resources, finance, and legal, including salaries, benefits, and other related costs. In our second quarter of 2024, we incurred an acquisition termination fee of $23.0 million (see Note 15 – Business Combinations).

(e) Other expense, net is presented on the accompanying Consolidated Statement of Operations and is primarily composed of interest expense and interest income.

60

Table of Contents

TOPBUILD CORP.
NOTES TO CONSOLIDATED FINANCIAL STATEMENTS

For the Year Ended December 31, 2023

Installation

Specialty Distribution

Total

Net sales from external customers

$

3,188,232

$

2,006,462

$

5,194,694

Intercompany net sales

261,877

261,877

Segment net sales

3,188,232

2,268,339

5,456,571

Reconciliation of Net Sales

Elimination of intercompany net sales

(261,877)

Consolidated net sales

$

5,194,694

Less (a):

Cost of sales (b)

2,101,751

1,706,562

3,808,313

Selling, general and administrative expenses (c)

442,089

230,839

672,928

Segment operating profit

644,392

330,938

975,330

Reconciliation of Segment Operating Profit

Elimination of intercompany profit

(44,438)

General corporate expense, net (d)

(52,067)

Other expense, net (e)

(53,342)

Consolidated income before taxes

$

825,483

(a) The significant expense categories align with the segment-level information that is regularly provided to our CODM.

(b) Cost of sales is primarily composed of labor, material costs and overhead.

(c) Selling, general and administrative expenses include allocation of corporate overhead, bad debt, bank fees, selling expenses, employee compensation, insurance, legal and consulting, office equipment & supplies, telecommunication & subscriptions, and travel & entertainment.

(d) General corporate expense, net includes expenses for functions such as corporate human resources, finance, and legal, including salaries, benefits, and other related costs.

(e) Other expense, net is presented on the accompanying Consolidated Statement of Operations and is primarily composed of interest expense and interest income.

61

Table of Contents

TOPBUILD CORP.
NOTES TO CONSOLIDATED FINANCIAL STATEMENTS

For the Year Ended December 31, 2022

Installation

Specialty Distribution

Total

Net sales from external customers

$

2,969,978

$

2,038,766

$

5,008,744

Intercompany net sales

239,495

239,495

Segment net sales

2,969,978

2,278,261

5,248,239

Reconciliation of Net Sales

Elimination of intercompany net sales

(239,495)

Consolidated net sales

$

5,008,744

Less (a):

Cost of sales (b)

2,012,135

1,709,547

3,721,682

Selling, general and administrative expenses (c)

409,048

242,488

651,536

Segment operating profit

548,795

326,226

875,021

Reconciliation of Segment Operating Profit

Elimination of intercompany profit

(39,839)

General corporate expense, net (d)

(38,018)

Other expense, net (e)

(55,029)

Consolidated income before taxes

$

742,135

(a) The significant expense categories align with the segment-level information that is regularly provided to our CODM.

(b) Cost of sales is primarily composed of labor, material costs and overhead.

(c) Selling, general and administrative expenses include allocation of corporate overhead, bad debt, bank fees, selling expenses, employee compensation, insurance, legal and consulting, office equipment & supplies, telecommunication & subscriptions, and travel & entertainment.

(d) General corporate expense, net includes expenses for functions such as corporate human resources, finance, and legal, including salaries, benefits, and other related costs.

(e) Other expense, net is presented on the accompanying Consolidated Statement of Operations and is primarily composed of interest expense and interest income.

62

Table of Contents

TOPBUILD CORP.
NOTES TO CONSOLIDATED FINANCIAL STATEMENTS

Key information by segment is as follows for the years ended December 31, 2024, 2023 and 2022, in thousands:

2024

Installation

Specialty Distribution

Total Reportable Segments

Other (a)

Consolidated Totals

Depreciation and amortization (b)

$

75,230

$

60,157

$

135,387

$

5,104

$

140,491

Property additions (c)

46,623

20,801

67,424

7,298

74,722

Total assets

2,226,358

2,078,482

4,304,840

430,586

4,735,426

2023

Installation

Specialty Distribution

Total Reportable Segments

Other (a)

Consolidated Totals

Depreciation and amortization (b)

$

69,123

$

59,607

$

128,730

$

4,148

$

132,878

Property additions (c)

48,076

18,859

66,935

8,394

75,329

Total assets

2,207,734

2,060,127

4,267,861

894,990

5,162,851

2022

Installation

Specialty Distribution

Total Reportable Segments

Other (a)

Consolidated Totals

Depreciation and amortization (b)

$

62,483

$

56,881

$

119,364

$

3,971

$

123,335

Property additions (c)

46,518

17,671

64,189

10,023

74,212

(a) Represents amounts held at Corporate not specifically attributed to or allocated to the segments.

(b) Represents total by segment, inclusive of amounts presented within cost of sales and selling, general and administrative expenses, as applicable.

(c) Property additions include assets acquired in business combinations in each respective year.

9.  ACCRUED LIABILITIES

The following table sets forth the components of accrued liabilities, in thousands:

As of December 31, 


2024


2023

Accrued liabilities:

Salaries, wages, and bonus/commissions

$

64,713

$

67,471

Insurance liabilities

31,013

29,920

Deferred revenue

18,651

18,365

Customer rebates

17,898

17,326

Sales and property taxes

13,884

17,002

Interest payable on long-term debt

12,307

12,139

Excise taxes

9,444

-

Other

23,876

24,994

Total accrued liabilities

$

191,786

$

187,217

See Note 3 – Revenue Recognition for discussion of our deferred revenue balances.

63

Table of Contents

TOPBUILD CORP.
NOTES TO CONSOLIDATED FINANCIAL STATEMENTS

10.  EMPLOYEE RETIREMENT PLANS

We provide a defined-contribution retirement plan for substantially all employees.  In addition, we participate in 38 active regional multi-employer pension plans, principally related to building trades; none of the plans are considered material.

The expense related to our participation in the retirement plans was as follows, in thousands:

Years Ended December 31,


2024


2023


2022

Defined contribution plans

$

19,054

$

18,710

$

17,946

Multi-employer plans

11,198

12,475

12,788

$

30,252

$

31,185

$

30,734

The Pension Protection Act (“PPA”) defines a zone status for multi-employer pension plans.  Plans in the green zone are at least 80 percent funded, plans in the yellow zone are at least 65 percent funded and plans in the red zone are generally less than 65 percent funded.  

We participate in the Carpenters Pension Trust Fund for Northern California (“NCT”), which is our second largest multi-employer plan expense and is in the red zone.  The NTC collective bargaining agreement expires on June 30, 2027.  The NCT has implemented a funding rehabilitation plan in accordance with government requirements.  Our contributions to NCT have not exceeded 1.5 percent of the total annual contributions to the plan.

Employer

Identification

PPA Zone Status

Funding Plan

Contributions (in thousands)

Surcharge

Pension Fund

Number/Plan Number

2024

2023

Pending / Implemented

2024

2023

2022

Imposed

NCT

94-6050970/001

Red

Red

Yes

$2,617

$2,821

$3,008

No

11.  OTHER COMMITMENTS AND CONTINGENCIES

Litigation. We are subject to certain claims, charges, litigation, and other proceedings in the ordinary course of our business, including those arising from or related to contractual matters, intellectual property, personal injury, environmental matters, product liability, product recalls, construction defects, insurance coverage, personnel and employment disputes, antitrust, and other matters, including class actions.  We believe we have adequate defenses in these matters, and we do not believe that the ultimate outcome of these matters will have a material adverse effect on us.  However, there is no assurance that we will prevail in any of these pending matters, and we could in the future incur judgments, enter into settlements of claims, or revise our expectations regarding the outcome of these matters, which could materially impact our liquidity and our results of operations.

Other Matters.  We enter into contracts, which include customary indemnities that are standard for the industries in which we operate.  Such indemnities include, among other things, claims against our builder customers for issues relating to our workmanship.  We generally exclude from our contracts with builder customers indemnity relating to product quality and warranty claims, as we pass such claims directly to the manufacturers of the products we install or distribute.  In conjunction with divestitures and other transactions, we occasionally provide customary indemnities relating to various items including, among others, the enforceability of trademarks, legal and environmental issues, and asset valuations.  We evaluate the probability that we may incur liabilities under these customary indemnities and appropriately record an estimated liability when deemed probable.

We also maintain indemnification agreements with our directors and officers that may require us to indemnify them against liabilities that arise by reason of their status or service as directors or officers, except as prohibited by applicable law.

64

Table of Contents

TOPBUILD CORP.
NOTES TO CONSOLIDATED FINANCIAL STATEMENTS

12.  INCOME TAXES

(In thousands)

2024

2023

2022

Income before income taxes:

U.S.

$

810,616

$

808,217

$

724,231

Foreign

30,172

17,266

17,904

Total

$

840,788

$

825,483

$

742,135

Income tax expense (benefit):

Current:

U.S. Federal

$

163,889

$

166,175

$

136,013

State and local

45,674

46,631

39,978

Foreign

10,415

7,193

3,406

Deferred:

U.S. Federal

22

(5,307)

7,016

State and local

166

(1,253)

(510)

Foreign

(1,980)

(2,210)

243

$

218,186

$

211,229

$

186,146

Deferred tax assets at December 31:

Receivables, net

$

4,786

$

6,089

Inventories

8,036

6,558

Other assets, principally share-based compensation

1,659

2,362

Accrued liabilities

17,038

21,073

Lease liability

17,488

16,887

Long-term liabilities

11,394

11,925

Long-term lease liability

32,873

37,515

Net operating loss carryforward

999

1,254

94,273

103,663

Deferred tax liabilities at December 31:

Right of use assets

48,057

52,441

Property and equipment, net

43,842

46,350

Intangibles, net

240,280

246,343

Other

2,437

2,459

334,616

347,593

Net deferred tax liability at December 31

$

240,343

$

243,930

A valuation allowance must be established for deferred tax assets when it is more-likely-than-not that they will not be realized.  After review of all available positive and negative evidence, the Company has determined that no valuation allowance was required for the deferred tax assets as of December 31, 2024 or December 31, 2023.

At December 31, 2024, the net deferred tax liability is $240.3 million, all of which is reported as long-term deferred tax liabilities.  At December 31, 2023, the net deferred tax liability is $243.9 million, all of which is reported as long-term deferred tax liabilities.  The deferred assets and deferred liabilities also include the state deferreds net of federal benefit.

Of the deferred tax asset related to the net operating loss carryforward at December 31, 2024, with few exceptions, $1.0 million will expire between 2026 and 2044.  Of the deferred tax asset related to the net operating loss carryforward at December 31, 2023, $1.3 million will expire between 2024 and 2035.

65

Table of Contents

TOPBUILD CORP.
NOTES TO CONSOLIDATED FINANCIAL STATEMENTS

A reconciliation of the U.S. Federal statutory tax rate to the income tax expense (benefit) on income was as follows:

Year Ended December 31,

2024

2023

2022

U.S. Federal statutory tax rate

21.0

%

21.0

%

21.0

%

State and local taxes, net of U.S. Federal tax benefit

4.3

4.3

4.2

Share based compensation

0.2

(0.1)

(0.2)

Effect of rates different than statutory

0.1

0.1

0.1

Non-deductible/non-taxable items (a)

0.2

0.2

0.1

Other, net (a)

0.2

0.1

(0.1)

Effective tax rate

26.0

%

25.6

%

25.1

%

(a) Certain prior year amounts have been reclassified to conform to current year presentation.

A tax expense of $1.9 million and a tax benefit of $1.4 million and $1.7 million related to share based compensation was recognized in income tax expense for the years ended December 31, 2024, 2023 and 2022, respectively.

We file income tax returns in the U.S. Federal jurisdiction, various U.S. state and local jurisdictions, and foreign jurisdictions. With few exceptions, we are no longer subject to income tax examinations on filed returns for years before 2019.

13.  NET INCOME PER SHARE

Basic net income per share is calculated by dividing net income by the weighted average shares outstanding during the period, without consideration for common stock equivalents. Diluted net income per share is calculated by adjusting weighted average shares outstanding for the dilutive effect of common stock equivalents outstanding for the period, determined using the treasury stock method.

Basic and diluted net income per share were computed as follows:

Years Ended December 31,

2024

2023

2022

Net income (in thousands)

$

622,602

$

614,254

$

555,989

Weighted average number of common shares outstanding - basic

30,504,064

31,597,508

32,213,839

Dilutive effect of common stock equivalents:

RSAs with service-based conditions

36,609

30,368

15,199

RSAs with market-based conditions

21,020

37,519

59,561

RSAs with performance-based conditions

27,298

25,645

46,601

Stock options

90,669

85,861

105,205

Weighted average number of common shares outstanding - diluted

30,679,660

31,776,901

32,440,405

Basic net income per common share

$

20.41

$

19.44

$

17.26

Diluted net income per common share

$

20.29

$

19.33

$

17.14

66

Table of Contents

TOPBUILD CORP.
NOTES TO CONSOLIDATED FINANCIAL STATEMENTS

The following table summarizes shares excluded from the calculation of diluted net income per share because their effect would have been anti-dilutive:

Year Ended December 31, 

2024

2023

2022

Anti-dilutive common stock equivalents:

RSAs with service-based conditions

-

-

14,882

RSAs with market-based conditions

3,271

3,876

157

RSAs with performance-based conditions

-

-

9,251

Stock options

-

504

21,006

Total anti-dilutive common stock equivalents

3,271

4,380

45,296

14.  SHARE-BASED COMPENSATION

Effective July 1, 2015, our eligible employees commenced participation in the 2015 LTIP.  The 2015 LTIP authorizes the Board to grant stock options, stock appreciation rights, restricted shares, restricted share units, performance awards, and dividend equivalents.  All grants are made by issuing new shares and no more than 4.0 million shares of common stock may be issued under the 2015 LTIP.  As of December 31, 2024, we had 1.7 million shares remaining available for issuance under the 2015 LTIP.

Share-based compensation expense is included in selling, general, and administrative expense.  The income tax effect associated with share-based compensation awards is included in income tax expense.  

The following table presents share-based compensation amounts recognized in our Consolidated Statements of Operations, in thousands:

Year Ended December 31, 

2024

2023

2022

Share-based compensation expense

$

16,579

$

15,838

$

12,310

Income tax (expense)/benefit

$

(1,942)

$

1,356

$

1,733

The following table presents a summary of our share-based compensation activity for the year ended December 31, 2024, in thousands, except per share amounts:

RSAs

Stock Options

Number of Shares


Weighted Average Grant Date Fair Value Per Share


Number of Shares


Weighted Average Grant Date Fair Value Per Share


Weighted Average Exercise Price Per Share


Aggregate
Intrinsic
Value

Balance December 31, 2023

195.5

$

223.49

128.7

$

36.65

$

98.58

$

35,462.8

Granted

46.0

$

419.05

$

$

Converted/Exercised

(53.1)

$

229.38

(16.0)

$

82.64

$

201.27

$

3,312.8

Forfeited/Expired

(12.4)

$

283.09

$

$

Balance December 31, 2024

176.0

$

269.50

112.7

$

30.10

$

83.97

$

25,604.9

Exercisable December 31, 2024 (a)

112.7

$

30.10

$

83.97

$

25,604.9

(a)The weighted average remaining contractual term for vested stock options is 4.2 years.

67

Table of Contents

TOPBUILD CORP.
NOTES TO CONSOLIDATED FINANCIAL STATEMENTS

We had unrecognized share-based compensation expense relating to unvested awards as shown in the following table, dollars in thousands:

As of December 31, 2024

Unrecognized Compensation Expense
on Unvested Awards

Weighted Average
Remaining
Compensation Expense Period

RSAs

$

18,634

0.9

Stock options

Total unrecognized compensation expense related to unvested awards

$

18,634

Our RSAs with performance-based conditions are evaluated on a quarterly basis with adjustments to compensation expense based on the likelihood of the performance target being achieved or exceeded.  The following table shows the range of payouts and the related expense for our outstanding RSAs with performance-based conditions, in thousands:

Payout Ranges and Related Expense

RSAs with Performance-Based Conditions

Grant Date Fair Value

0%

25%

100%

200%

February 15, 2022

$

2,907

$

-

$

727

$

2,907

$

5,814

February 21, 2023

$

3,830

$

-

$

958

$

3,830

$

7,660

February 21, 2024

$

4,452

$

-

$

1,113

$

4,452

$

8,904

During the first quarter of 2024, RSAs with performance-based conditions that were granted on February 16, 2021 vested based on cumulative three-year achievement of 200%. Total compensation expense recognized over the three-year performance period, net of forfeitures, was $4.4 million.

The fair value of our RSAs with a market-based condition granted under the 2015 LTIP was determined using a Monte Carlo simulation.  The following are key inputs in the Monte Carlo analysis for awards granted in 2024, 2023 and 2022:

2024

2023

2022

Measurement period (years)

2.86

2.86

2.87

Risk free interest rate

4.36

%

4.42

%

1.76

%

Dividend yield

0.00

%

0.00

%

0.00

%

Estimated fair value of market-based RSAs at grant date

$

503.68

$

270.64

$

298.20

As a result of the Company's performance against a group of peers based on relative total shareholder return, our RSAs with a market-based condition that were granted on February 15, 2022, did not meet the established performance criteria, and will be forfeited in the first quarter of 2025.

15.  BUSINESS COMBINATIONS

Acquiring businesses is a key part of our ongoing strategy to grow our company and expand our offerings. Each acquisition has been accounted for as a business combination under ASC 805, “Business Combinations.” Acquisition-related costs for the years ended December 31, 2024 and 2023, were $27.9 million and $16.2 million, respectively. Acquisition-related costs for the year ended December 31, 2024 includes $23.0 million paid in connection with the mutual termination of our previous agreement to acquire SPI. Acquisition-related costs are included in selling, general, and administrative expense in our Consolidated Statements of Operations.

On February 15, 2024, we acquired the assets of the residential and light commercial insulation business Brabble. This installation acquisition enhanced our presence in North Carolina. The purchase price of $5.4 million was funded by cash on hand and we recognized $2.9 million of goodwill in connection with this acquisition.

68

Table of Contents

TOPBUILD CORP.
NOTES TO CONSOLIDATED FINANCIAL STATEMENTS

On March 1, 2024, we acquired the assets of the residential insulation business Morris Black. This installation acquisition enhanced our presence in Pennsylvania. The purchase price of $3.6 million was funded by cash on hand and we recognized $2.0 million of goodwill in connection with this acquisition.

On March 1, 2024, we acquired the assets of the customized insulation products and accessories business PCI. This specialty distribution acquisition has a national customer base focused on the domestic pest control industry. The purchase

price of $13.8 million was funded by cash on hand and we recognized $5.7 million of goodwill in connection with this acquisition.

On April 18, 2024, we acquired the assets of the residential and light commercial insulation business Green Space. This installation acquisition enhanced our presence in Missouri and neighboring states. The purchase price of approximately $4.3 million was funded by cash on hand and we recognized $2.6 million of goodwill in connection with this acquisition.

On May 16, 2024, we acquired the assets of the residential and light commercial insulation business Insulation Works. This installation acquisition enhanced our presence in Arkansas and extended our expertise to the agricultural business. The purchase price of approximately $25.5 million was funded by cash on hand and we recognized $14.9 million of goodwill in connection with this acquisition.

On May 31, 2024, we acquired the assets of the residential and light commercial insulation business Texas Insulation. This installation acquisition enhanced our presence in Texas. The purchase price of approximately $35.9 million was funded by cash on hand and we recognized $22.8 million of goodwill in connection with this acquisition.

On December 2, 2024, we acquired the assets of Shannon, which designs and fabricates reusable thermal, acoustical and safety products to multinational customers. This specialty distribution acquisition enhances our capabilities in mechanical insulation and our fabrication offerings to commercial and industrial end user markets. The purchase price of approximately $12.9 million was funded by cash on hand and we recognized $6.1 million of goodwill in connection with this acquisition.

On December 2, 2024, we acquired the assets of the commercial and industrial mechanical insulation distributor business of Metro. This specialty distribution acquisition enhances our presence in the New York/New Jersey and the Baltimore/Washington metropolitan areas. The purchase price of approximately $35.4 million was funded by cash on hand and we recognized $18.0 million of goodwill in connection with this acquisition.

The table below provides a summary of businesses acquired in 2024 including the net sales and net income incurred for the year ended December 31, 2024:

2024 Acquisitions

Date


Cash Paid

Goodwill Acquired

Net Sales

Net Income

Insulation Works

5/16/2024

$

25,533

$

14,911

$

18,433

$

2,092

Texas Insulation

5/31/2024

35,901

22,837

20,500

2,359

Metro

12/2/2024

35,400

17,956

2,833

64

All others

Various

39,970

19,318

36,256

4,564

Total

$

136,804

$

75,022

$

78,022

$

9,079

69

Table of Contents

TOPBUILD CORP.
NOTES TO CONSOLIDATED FINANCIAL STATEMENTS

The estimated fair values of the assets acquired and liabilities assumed for our 2024 acquisitions are as follows as of December 31, 2024, in thousands:

2024 Acquisitions

Purchase price fair values:

Insulation Works

Texas Insulation

Metro

All Others

Totals

Accounts receivable

$

2,242

$

2,755

$

9,362

$

8,780

$

23,139

Inventories

1,217

754

3,218

2,711

7,900

Prepaid and other assets

40

99

107

246

Property and equipment

1,267

1,798

701

1,496

5,262

ROU asset (operating)

359

1,142

2,596

1,361

5,458

Intangible assets

7,988

12,831

9,669

11,706

42,194

Goodwill

14,911

22,837

17,956

19,318

75,022

Accounts payable

(2,243)

(5,157)

(5,515)

(3,552)

(16,467)

Lease liabilities (operating)

(359)

(1,142)

(2,596)

(1,361)

(5,458)

All other

151

43

(90)

(596)

(492)

Net assets acquired

$

25,533

$

35,901

$

35,400

$

39,970

$

136,804

The estimate of acquired customer relationships related to our 2024 acquisitions was $42.2 million and the weighted average useful life is 12 years.

On January 26, 2023, we acquired the assets of the residential insulation business of SRI. This installation acquisition enhanced our presence in Georgia, Michigan, Ohio, Florida, Alabama and South Carolina. The purchase price of $45.3 million was funded by cash on hand.

On July 17, 2023, we acquired the assets of the residential insulation business Best. This installation acquisition enhanced our presence in Texas, Arizona, Tennessee, and Florida markets. The purchase price of $94.6 million was funded by cash on hand.

The table below provides a summary of businesses acquired in 2023 including the net sales and net income incurred for the year ended December 31, 2024:

2023 Acquisitions

Date


Cash Paid

Goodwill Acquired

Net Sales

Net Income

SRI

1/23/2023

$

45,314

$

23,065

$

54,898

$

3,282

Best

7/17/2023

94,590

51,418

66,073

3,031

All others

Various

9,113

4,492

8,406

1,232

Total

$

149,017

$

78,975

$

129,377

$

7,545


70

Table of Contents

TOPBUILD CORP.
NOTES TO CONSOLIDATED FINANCIAL STATEMENTS

The table below represents the finalized fair values of assets acquired and liabilities assumed as of December 31, 2024, for the acquisitions made during the year ended December 31, 2023:

2023 Acquisitions


SRI


Best


All Others


Totals

Purchase price fair values:

Accounts receivable

$

5,531

$

7,537

$

968

$

14,036

Inventories

4,383

2,132

602

7,117

Prepaid and other assets

158

43

201

Property and equipment

4,623

5,518

419

10,560

ROU asset (operating)

4,695

3,441

412

8,548

Intangible assets

13,740

30,470

2,948

47,158

Goodwill

23,065

51,418

4,492

78,975

Accounts payable

(6,078)

(2,623)

(343)

(9,044)

Lease liabilities (operating)

(4,775)

(3,241)

(412)

(8,428)

All other

(28)

(105)

27

(106)

Net assets acquired

$

45,314

$

94,590

$

9,113

$

149,017

Purchase Price Allocations

As third-party or internal valuations are finalized, certain tax aspects of the foregoing transactions are completed, and customer post-closing reviews are concluded, adjustments may be made to the fair value of assets acquired, and in some cases total purchase price, through the end of each measurement period, generally one year following the applicable acquisition date.

Goodwill to be recognized in connection with acquisitions is attributable to the synergies expected to be realized and improvements in the businesses after the acquisitions.  Primarily all of the goodwill recorded during the years ended December 31, 2024 and 2023, respectively, is deductible for income tax purposes.

16.  SHARE REPURCHASE PROGRAM

On July 25, 2022, our Board authorized the 2022 Repurchase Program, pursuant to which the Company could purchase up to $200 million of our common stock.  The Company completed its 2022 Repurchase Program during 2024 for a total of 677,657 shares of our common stock at a weighted average cost of $295.13 per share.

On May 3, 2024, our Board authorized the 2024 Repurchase Program, pursuant to which the Company may purchase up to $1.0 billion of our common stock.  Share repurchases may be executed through various means including open market purchases, privately negotiated transactions, accelerated share repurchase transactions, or other available means.  The 2024 Repurchase Program does not obligate the Company to purchase any shares and has no expiration date.  Authorization for the 2024 Repurchase Program may be terminated, increased, or decreased by the Board at its discretion at any time. As of December 31, 2024, the Company has $188.1 million remaining under the 2024 Share Repurchase Program.

Effective January 1, 2023, the Inflation Reduction Act of 2022 mandated a 1% excise tax on all share repurchases. Excise tax obligations that result from our share repurchases are included in the cost of treasury stock. As of December 31, 2024, the Company had an estimated excise tax liability of $9.4 million for stock repurchases during the year ended December 31, 2024, which is included in “Accrued liabilities” in our Consolidated Balance Sheet.

71

Table of Contents

TOPBUILD CORP.
NOTES TO CONSOLIDATED FINANCIAL STATEMENTS

The following table sets forth our share repurchases under the share repurchases programs in 2024. No shares were repurchased during 2023.

Year Ended December 31, 

2024


2023


2022

Number of shares repurchased

2,455,872

-

1,390,667

Share repurchase cost (in thousands) (a)


$

975,796

$

-

$

250,050

(a)The year ended December 31, 2024 includes $9.4 million of excise taxes

17.  SUBSEQUENT EVENTS

On February 17, 2025, our Board authorized the 2025 Repurchase Program, pursuant to which the Company may purchase up to $1.0 billion of our common stock.  Share repurchases may be executed through various means including open market purchases, privately negotiated transactions, accelerated share repurchase transactions, or other available means.  The 2025 Repurchase Program does not obligate the Company to purchase any shares and has no expiration date.  Authorization for the 2025 Repurchase Program may be terminated, increased, or decreased by the Board at its discretion at any time.

72

Table of Contents

ITEM 9.  CHANGES IN AND DISAGREEMENTS WITH ACCOUNTANTS ON ACCOUNTING AND FINANCIAL DISCLOSURE

None.

Item 9A.  CONTROLS AND PROCEDURES

Evaluation of Disclosure Controls and Procedures

As of the end of the period covered by this Annual Report, we carried out an evaluation, under the supervision and with the participation of our principal executive officer and principal financial officer, of the effectiveness of the design and operation of our disclosure controls and procedures (as such term is defined in Rules 13a-15(e) and 15d-15(e) under the Exchange Act).  Based on this evaluation, our principal executive officer and principal financial officer concluded that our disclosure controls and procedures were effective as of December 31, 2024.

Management’s Report on Internal Control over Financial Reporting

The management of the Company is responsible for establishing and maintaining adequate internal control over financial reporting as defined in Rules 13a-15(f) and 15d-15(f) under the Exchange Act.  The Company’s internal control over financial reporting is designed to provide reasonable assurance regarding the reliability of financial reporting and the preparation of financial statements for external purposes in accordance with GAAP.  The Company’s internal control over financial reporting includes those policies and procedures that: (i) pertain to the maintenance of records that, in reasonable detail, accurately and fairly reflect the transactions and dispositions of the assets of the Company; (ii) provide reasonable assurance that transactions are recorded as necessary to permit preparation of financial statements in accordance with GAAP and that receipts and expenditures of the Company are being made only in accordance with authorizations of management and directors of the Company; and (iii) provide reasonable assurance regarding prevention or timely detection of unauthorized acquisition, use or disposition of the Company’s assets that could have a material effect on the financial statements.

Because of its inherent limitations, internal control over financial reporting may not prevent or detect misstatements.  Also, projections of any evaluation of effectiveness to future periods are subject to the risk that controls may become inadequate because of changes in conditions or that the degree of compliance with the policies or procedures may deteriorate.

Management assessed the effectiveness of the Company’s internal control over financial reporting as of December 31, 2024. In making this assessment, management used the criteria set forth by the Committee of Sponsoring Organizations of the Treadway Commission in Internal Control—Integrated Framework (2013).  Based on our assessment and those criteria, management concluded that the Company’s internal control over financial reporting was effective as of December 31, 2024.

The effectiveness of the Company’s internal control over financial reporting as of December 31, 2024, has been audited by PricewaterhouseCoopers LLP, an independent registered public accounting firm, as stated in their report appearing under Item 8. Financial Statements and Supplementary Data – Report of Independent Registered Public Accounting Firm.

Changes in Internal Control Over Financial Reporting

There was no change in the Company’s internal control over financial reporting (as such term is defined in Rules 13a-15(f) and 15d-15(f) under the Exchange Act) in the fiscal quarter ended December 31, 2024, that has materially affected, or is reasonably likely to materially affect, the Company’s internal control over financial reporting.

Item 9B. OTHER INFORMATION

During the quarter ended December 31, 2024, no director or officer (as defined in Rule 16a-1(f) promulgated under the Exchange Act) of the Company adopted, modified or terminated a “Rule 10b5-1 trading arrangement” or a “non-Rule 10-b5-1 trading arrangement” (as each term is defined in Item 408 of Regulation S-K).

73

Table of Contents

PART III

Item 10.  DIRECTORS, EXECUTIVE OFFICERS, AND CORPORATE GOVERNANCE

For information regarding our executive officers see Item 1. Business – Executive Officers, which we incorporate herein by reference. Further information required by this item will be set forth in our definitive proxy statement for the 2025 Annual Meeting of Shareholders (“2025 Proxy Statement”) to be filed with the SEC within 120 days of the year ended December 31, 2024, and is incorporated herein by reference.

Our Board of Directors adopted a Code of Business Conduct and Ethics (the “Code”) that applies to all of our employees, officers, and directors, including our Chief Executive Officer, Chief Financial Officer, and other senior officers, in accordance with applicable rules and regulations of the SEC and the NYSE.  Our Code is available on our website at https://www.topbuild.com/ESG/corporate-governance.  We will disclose any amendments to or waivers of this Code for directors, executive officers, or senior officers on our website.  The reference to our website address does not constitute incorporation by reference of the information contained on the website, and such information is not a part of this Annual Report.

Insider Trading Compliance Policy:

We have adopted an insider trading compliance policy that governs the purchase, sale, and/or other transactions of our securities by our directors, officers and employees, family members of such persons, and trusts, corporations and other entities controlled by any of such persons.  We believe that our policy is reasonably designed to promote compliance with insider trading laws, rules and regulations, and NYSE listing standards.  A copy of our insider trading compliance policy is filed as Exhibit 19.1 to this Annual Report on Form 10-K.

Timing of Equity Grants:

We do not have a formal policy that requires the Company to grant, or avoid granting, equity-based compensation to our directors or executive officers at certain times.  We routinely grant long-term equity awards to our executive officers in connection with annual compensation reviews at our February Board meeting based on our long-range planning process and the benchmarking advice of our compensation consultant, and to our directors in connection with annual elections immediately following our annual meeting of shareholders.  The timing of equity grants to directors or executive officers in connection with new hires, promotions, or other non-routine grants is tied to the event giving rise to the award, such as commencement of employment/services or promotion effective date.  As a result, in all cases, the timing of grants of equity awards occurs independently of the release of any material nonpublic information and the Company does not time the disclosure of material nonpublic information for the purpose of affecting the value of equity-based compensation.

During the year ended December 31, 2024, there were no equity grants made to directors or executive officers of the Company during any period beginning four business days before the filing of a periodic report or current report disclosing material nonpublic information and ending one business day after the filing or furnishing of such report with the SEC.

Item 11.  EXECUTIVE COMPENSATION

Information required by this item will be set forth in our 2025 Proxy Statement, and is incorporated herein by reference.

Item 12.  SECURITY OWNERSHIP OF CERTAIN BENEFICIAL OWNERS AND MANAGEMENT, AND RELATED SHAREHOLDER MATTERS

Information required by this item will be set forth in our 2025 Proxy Statement, and is incorporated herein by reference.

Item 13.  CERTAIN RELATIONSHIPS AND RELATED TRANSACTIONS, AND DIRECTOR INDEPENDENCE

Information required by this item will be set forth in our 2025 Proxy Statement, and is incorporated herein by reference.

74

Table of Contents

Item 14.  PRINCIPAL ACCOUNTING FEES AND SERVICES

Information required by this item will be set forth in our 2025 Proxy Statement, and is incorporated herein by reference.

PART IV

Item 15.  EXHIBITS AND FINANCIAL STATEMENT SCHEDULES

a.Listing of Documents:

i.Financial Statements.  Our Consolidated Financial Statements included in Item 8 hereof, as required at December 31, 2024 and 2023, and for the years ended December 31, 2024, 2023, and 2022, consist of the following:

Consolidated Balance Sheets

Consolidated Statements of Operations

Consolidated Statements of Comprehensive Income

Consolidated Statements of Cash Flows

Consolidated Statements of Changes in Shareholders’ Equity

Notes to Consolidated Financial Statements

ii.Exhibits.  See separate Index to Exhibits hereafter.

Item 16.  FORM 10-K SUMMARY

None.

75

Table of Contents

INDEX TO EXHIBITS


Incorporated by Reference

Filed

Exhibit No.


Exhibit Title


Form


Exhibit


Filing Date


Herewith

2.1***

Separation and Distribution Agreement, dated as of June 29, 2015, by and between Masco Corporation and TopBuild Corp.

8-K

2.1

7/6/2015

3.1

Composite Certificate of Incorporation of TopBuild Corp.

10-Q

3.2

7/8/2018

3.2

Amended and Restated Bylaws of TopBuild Corp., as Amended July 29, 2019

10-K

3.2

2/25/2020

3.3

Certificate of Amendment to the Amended and Restated Certificate of Incorporation

8-K

3.1

4/30/2019

4.1

Description of TopBuild Securities Registered Under Section 12 of the Exchange Act

10-K

4.3

2/25/2020

4.2

Indenture, dated March 15, 2021, by and among TopBuild Corp., the Guarantors party thereto and U.S. Bank National Association, as Trustee

8-K

4.01

03/16/2021

4.3

Form of 3.625% Senior Note due 2029

8-K

4.02

03/16/2021

4.4

Indenture, dated October 14, 2021, by and among TopBuild Corp., the Guarantors party thereto and U.S. Bank National Association, as Trustee

8-K

4.01

10/15/2021

4.5

Form of 4.125% Senior Note due 2032

8-K

4.02

10/15/2021

10.1

Change in Control and Severance Agreement between Gerald Volas and TopBuild Corp.

10-K

10.11

3/3/2016

10.2

Amended and Restated TopBuild Corp. 2015 Long Term Stock Incentive Plan (“A&R LTIP”)

10-Q

10.2

5/11/2016

10.3

Amendment to the TopBuild Corp. 2015 Long Term Stock Incentive Plan

8-K

10.1

2/22/2019

10.4

Amendment to Change in Control and Severance Agreement dated as March 1, 2016 between TopBuild Corp. and Gerald Volas

8-K

10.3

2/22/2019

10.5

Employment and Retirement Transition Agreement, dated as of January 9, 2020, between TopBuild Corp. and Gerald Volas.

8-K

10.1

1/10/2020

10.6

Amended and Restated Security and Pledge Agreement, dated March 20, 2020, among TopBuild Corp., Bank of America, N.A., as administrative agent, and the grantors party thereto.

8-K

10.2

3/23/2020

10.7

TopBuild Corp. Executive Severance Plan, as Amended effective October 28, 2024

10-Q

10.16

11/5/2024

10.8

Amendment No. 3 to Amended and Restated Credit Agreement, dated December 9, 2022 among TopBuild Corp., Bank of America, N.A. as administrative agent, and the other lenders and agents party thereto.

10-K

10.13

2/23/2023

10.9

Amended and Restated Credit Agreement, dated March 20, 2020, among TopBuild Corp., Bank of America, N.A. as administrative agent, and the other lenders and agents party thereto, as amended by Amendment No. 3.

10-K

10.14

2/23/2023

76

Table of Contents


Incorporated by Reference

Filed

Exhibit No.


Exhibit Title


Form


Exhibit


Filing Date


Herewith

10.10

Form of Loan Notice to Amended and Restated Credit Agreement, dated March 20, 2020, among TopBuild Corp., Bank of America, N.A. as administrative agent, and the other lenders and agents party thereto, as amended by Amendment No. 3.

10-K

10.15

2/23/2023

10.11

Amendment No. 4 to Amended and Restated Credit Agreement and Increase Joinder, dated July 26, 2023, among TopBuild Corp., Bank of America, N.A. as administrative agent, and the other lenders and agents party thereto.

10-Q

10.16

8/3/2023

10.12

Form of Restricted Stock Unit Award Agreement under A&R LTIP (revised October 2023)

10-K

10.13

2/28/2024

10.13

Form of Performance Restricted Stock Unit Award Agreement under A&R LTIP (revised October 2023)

10-K

10.14

2/28/2024

10.14

Form of Restricted Stock Award Agreement for Non-Employee Directors under A&R LTIP (revised October 2023)

10-K

10.15

2/28/2024

19.1

TopBuild Corp. Securities Trading Policy

X

21.1

List of Subsidiaries of TopBuild Corp.

X

23.1

Consent of PricewaterhouseCoopers, LLP

X

31.1

Principal Executive Officer Certification required by Rules 13a-14 and 15d-14 as adopted pursuant to Section 302 of the Sarbanes-Oxley Act of 2002

X

31.2

Principal Financial Officer Certification required by Rules 13a-14 and 15d-14 as adopted pursuant to Section 302 of the Sarbanes-Oxley Act of 2002

X

32.1‡

Certification of Principal Executive Officer pursuant to 18 U.S.C. Section 1350, as adopted pursuant to Section 906 of Sarbanes Oxley Act of 2002

32.2‡

Certification of Principal Financial Officer pursuant to 18 U.S.C. Section 1350, as adopted pursuant to Section 906 of Sarbanes Oxley Act of 2002

97.1

Executive Officer Incentive Compensation Recovery Policy

10-K

10.12

2/28/2024

101.INS

Inline XBRL Instance Document - the Instance Document does not appear in the Interactive Data File because its XBRL tags are embedded within the Inline XBRL document.

X

101.SCH

Inline XBRL Taxonomy Extension Schema Document

X

101.CAL

Inline XBRL Taxonomy Extension Calculation Linkbase Document

X

101.DEF


Inline XBRL Taxonomy Extension Definition Linkbase


X

101.LAB

Inline XBRL Taxonomy Extension Label Linkbase Document

X

101.PRE

Inline XBRL Taxonomy Extension Presentation Linkbase Document

X

104

Cover Page Interactive Data File (formatted as Inline XBRL and contained in Exhibit 101)

X

† Indicates management contract or compensatory plan, contract or arrangement.

77

Table of Contents

*** The schedules and exhibits to this agreement have been omitted pursuant to Item 601(c) of Regulation S-K. The Company agrees to supplementally furnish to the SEC, upon request, a copy of any omitted schedule or exhibit.

‡Furnished herewith.

78

Table of Contents

SIGNATURES

Pursuant to the requirements of Section 13 or 15(d) of the Securities Exchange Act of 1934, the registrant has duly caused this report to be signed on its behalf by the undersigned, thereunto duly authorized.


TOPBUILD CORP.


By:

/s/ Robert Kuhns


Name:

Robert Kuhns


Title:

Vice President and Chief Financial Officer

February 25, 2025

Pursuant to the requirements of the Securities Exchange Act of 1934, this report has been signed below by the following persons on behalf of the registrant and in the capacities and on the dates indicated.

Signature

Title

Date

/s/ Robert Buck

Director, Chief Executive Officer

February 25, 2025

Robert Buck

(Principal Executive Officer)

/s/ Robert Kuhns

Vice President, Chief Financial Officer

February 25, 2025

Robert Kuhns

(Principal Financial Officer)

/s/ Madeline Otero

Chief Accounting Officer

February 25, 2025

Madeline Otero

(Principal Accounting Officer)

/s/ Alec C. Covington

Chairman of the Board

February 25, 2025

Alec C. Covington

/s/ Ernesto Bautista, III

Director

February 25, 2025

Ernesto Bautista, III

/s/ Joseph S. Cantie

Director

February 25, 2025

Joseph S. Cantie

/s/ Tina M. Donikowski

Director

February 25, 2025

Tina M. Donikowski

/s/ Deirdre Drake

Director

February 25, 2025

Deirdre Drake

/s/ Mark A. Petrarca

Director

February 25, 2025

Mark A. Petrarca

/s/ Nancy M. Taylor

Director

February 25, 2025

Nancy M. Taylor

79